Debt in the State of Rhode Island
The treasurer’s office has released the latest iteration of its Debt Affordability Study, and it’s certainly a feast for data hogs. Naturally, the state government concludes that, for the most part, Rhode Island and its municipalities are doing just fine, and even have some additional capacity for debt.
That conclusion rests on an analysis of investment ratings agencies’ scoring methodologies, with the conclusion that a municipality shouldn’t have total debt (including pensions, other post-employment benefits, etc.) that is more than 22.5% of government expenditures or 9.2% of the full value of taxable property. For the state, it’s 18% of general revenue and 12% of personal income.
Of course, that top line skips over the important nuances, like which liability number should be used for pensions (total liability versus unfunded liability). If one were to go down that road, however, the entire analysis would be wiped out by the reality that government entities calculate those debts in a near-fraudulent way that assumes far too much return on their investments.
So, that’s the conclusion if we start with an abstract and, in some respects, arbitrary limit created by ratings agencies. Their interests justify mention: The ratings agencies are above all concerned with the ability of a government entity to pay its debts. The debt cap, therefore, can be understood to be the limit above which investors should be concerned that — by one mechanism or another — the government will refuse to pay what it owes. That may not be a “revolution threshold,” but one can imagine the political conditions under which such dereliction would happen.
Looking at the question from a different perspective would obviously produce a different conclusion. One way or another, if your city or town is committed 9% of the value of your house to its own debt, that wealth is not available to you. If 18% of the state’s revenue is going toward debt, those resources can’t fix roads. Taxpayers might have a very different answer if they’re asked whether one-tenth of their property value and one-fifth of their income represents “affordable” debt.
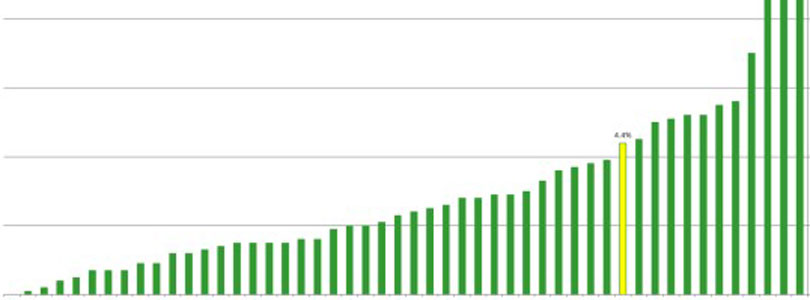
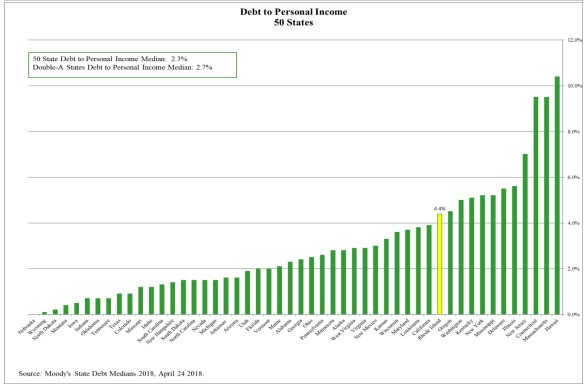
This perspective is a bit more relevant to the portion of the report that compares Rhode Island to other states, in which case Rhode Island consistently is in the top 15. This chart from the report, for example, shows that Rhode Island is has the 12th highest ratio of debt to personal income in the state:
This should be of particular concern in light of the following finding by Patrick Anderson in the Providence Journal:
Tax supported [direct] debt as a share of resident personal income, however, rose to 3.96% last year, basically at the 4% recommended limit. It was from 3.4% in mid-2016.
Some of that trend derives from an increase in direct debt. But as the data used for the RI Center for Freedom & Prosperity’s Jobs & Opportunity Index (JOI) illustrates, the state’s income growth has been painfully slow. Rhode Islanders personal income (including from investments) at the end of 2016 was $44.5 billion, which hadn’t changed by the end of 2017. A year later, the number had grown to $46.3 billion. That’s just 2% growth per year. Take out investment income, and the annual increase is only around 1.25%.
A debt affordability study that doesn’t look at such trends is like inspection of a ship that doesn’t take into account that it’s headed toward the land.