Employment and Jobs Difference Another Red Flag for Rhode Island
“What gives?” That’s how somebody asked me why I was proclaiming doom and gloom based on last week’s employment report while the Providence Journal was touting 1,900 new Rhode Island jobs in September and October. The answer has to do with how the numbers are collected and what they represent.
The employment numbers that I track each month (and from which the official unemployment rate derives) come from the Local Area Unemployment Statistics (LAUS) program of the U.S. Department of Labor’s Bureau of Labor Statistics (BLS). The basis for the monthly reports is the Current Population Survey (CPS), for which the U.S. Census calls households and asks respondents questions about whether they are working.
The jobs numbers that the Providence Journal noted (and which Governor Chafee’s administration has been emphasizing for a while, now, given that they paint a nicer picture) come from the BLS Current Employment Statistics (CES) program, which surveys businesses about their payrolls.
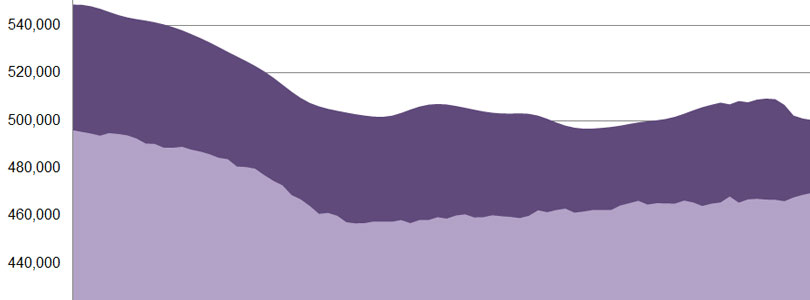
Given the different methodologies, the numbers aren’t exactly comparable, in the sense that one couldn’t expect to find a particular Rhode Islander in both data sets. Still, if the results are independently statistically valid, then in the aggregate, one can combine them for a picture of the Rhode Island employment scene. Putting them on the same chart produces the following results.

The lighter area is the number of RI-based jobs according to the CES; the darker area is the number of Rhode Islanders, above and beyond that number, who say that they are employed, according to the LAUS.
For the purposes of comparing the two numbers, the lighter area is surely too large, because:
- It includes people from out of state whose jobs are based in Rhode Island, whether they live in nearby states or telecommute from distant lands. Consequently, if more Rhode Islanders work elsewhere than outsiders work here (which seems likely, given relative economic health), then the light area includes non-Rhode Islanders. Taking them out would expand the dark area downward.
- Part-time jobs count differently. Each part-time job in Rhode Island counts in the light area, without regard to whether it is somebody’s second job. If three businesses each made one full-time job into two part-time jobs and the three people who originally filled them switched places, part-time, to maintain their hours, the number of RI-based jobs would double while number of people employed would remain the same. With part-time jobs generally understood to be on the rise, in the United States, some employed Rhode Islanders are likely being double-counted in the light area.
So, with those caveats acknowledged, who is in the dark purple area? Put differently, who is losing ground to justify my doom and gloom despite the increase in jobs?
Comparing the definitions of “employment” for the CES program and the LAUS program, the answer is:
- Rhode Islanders whose jobs are based elsewhere who aren’t canceled out by people from elsewhere who work here (probably less than zero)
- Farm workers
- Business owners
- Self-employed
- Independent contractors
- Family members or volunteers who are not directly paid for their work
Statistics collected separately by the U.S. Dept. of Agriculture on Rhode Island farms suggest that the industry accounts for fewer than 3,000 people (many of whom have other jobs besides farming). Removing farmers from the count still leaves nearly 30,000 Rhode Islanders, which is about double the number of jobs that Rhode Island has in the Construction industry, and only a little bit less than in the Financial Activities industry.
It would take only a little bit of overstated flare to say that the CES jobs data leaves out the entire “entrepreneur sector” of the economy. That puts the conflicting trends in the chart in quite a different light.
Since the low-point of the RI-based jobs curve, in August 2009, the state has added 12,800 jobs (still down 26,800 from its peak month of December 2006). That’s an average annual increase of 9,600, or 2%. Over that same span, the total number of employed Rhode Islanders has fallen by 2,441.*
In other words, businesses have been growing their workforces (at less than the rate of inflation), but the segment of the total labor force that is arguably both the most responsive to the local economy and the most economically productive — especially in the area of innovating and finding new directions for the state’s labor force — has been fading.
That dynamic may, in fact, be an overall positive for people who want to centrally manage Rhode Island’s economy, in a system that prioritizes connections and conformity. But for regular folks who want to live in a dynamic region of promise and opportunity, it’s yet another signal to look elsewhere.
* These numbers are seasonally adjusted, so the different months at the start and end of the time span theoretically have limited relevance.
