Rhode Island Cities and Towns, Where They Are and Where They’ve Been, Part 2
Rhode Island, from Census to Census
Whereas part 1 of this series took a snapshot view of Rhode Island in 2010, what follows traces trends from one year of the U.S. Census (2000) to the next (2010).
Overall, the percentage of Rhode Island’s population technically of working age (18 to 65) increased by 2.2% from 2000 to 2010. In keeping with the trend, the state’s labor force participation rate (the portion of the total population working or seeking work) increased by 2.4 percentage points, from 51.8% in 2000 to 54.2% in 2010. In other words, for the most part, a broad brush paints the state’s population becoming of working age and entering the marketplace.
Of course, the story is more complicated than that. Overall, the state’s population increased by 4,248 people, and we know from migration data that thousands have come and gone. According to data soon to be released by the Rhode Island Center for Freedom & Prosperity, over those years, Rhode Island lost a net of 1,554 taxpaying households, accounting for 6,161 people.
An answer to the question of how the state’s population has changed therefore must account for an overall increase in people, as well as an overall increase in the percentage of people of working age, combined with a decreasing number of federal income-tax payers (with a net loss in AGI, meaning that wealthier people are leaving than coming). Add into the mix that the state just barely kept pace with inflation over the decade. Either Rhode Island is becoming a land of tax cheats, or it spent the last decade trading middle-income families with children for less-wealthy families without.
But the generalized, statewide story is only so useful. The story of Rhode Island’s economy is actually the multiple stories of its cities and towns. In that regard, there are a few telling observations to be made.
Where the Population Fell
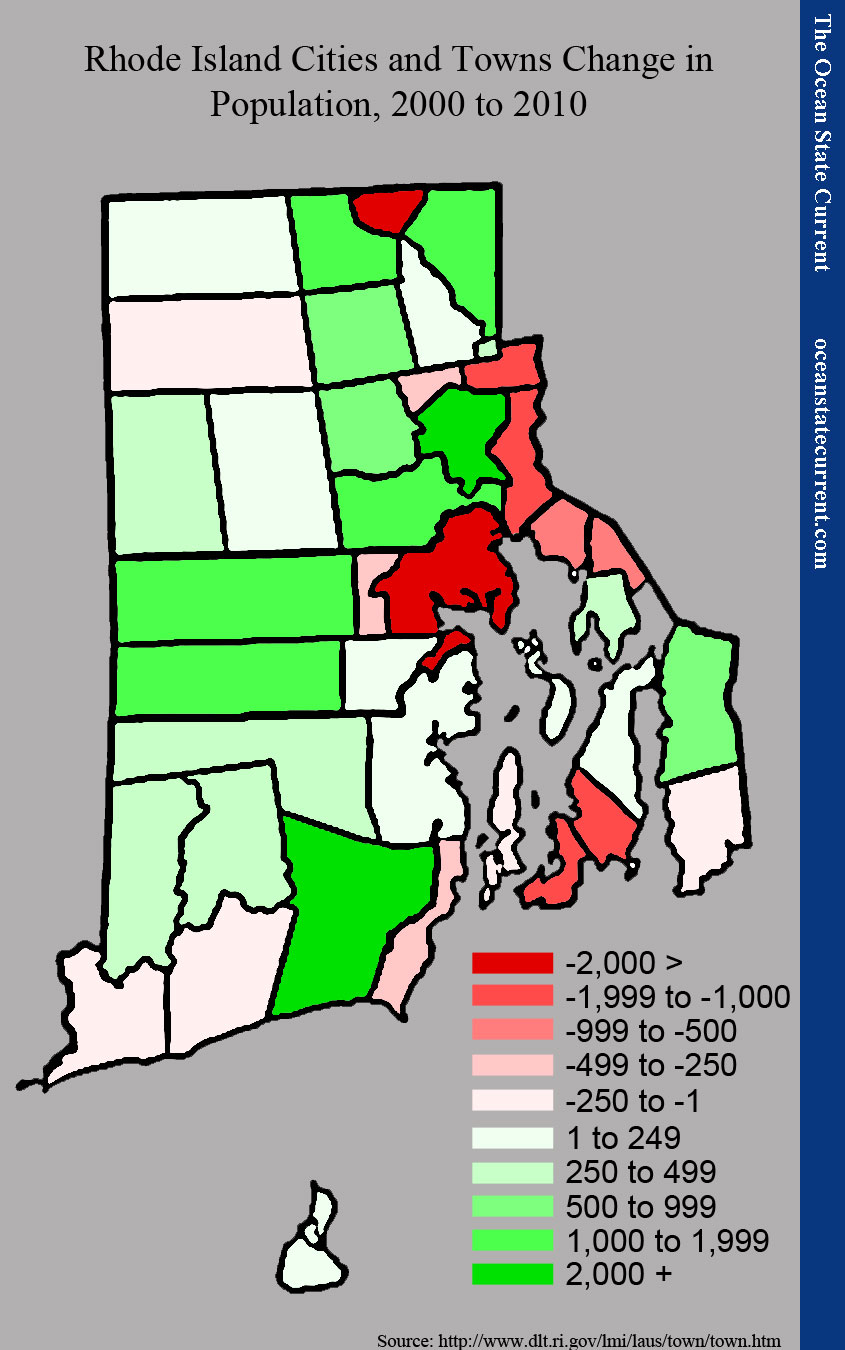
To understand where Rhode Islanders are moving to and from, inside the state, consider the population changes in terms of the actual number of people. (For a key of which cities and towns are which, see here.)
The plight of Woonsocket, which lost 2,038 residents, is not surprising. As subsequent maps will show, its employment has plummeted, and its median household income has fallen short of inflation by a significant degree. More generally, the city is known to be among the most troubled in the state.
More surprising is Warwick, which (despite a reputation as one of the healthier communities) lost more residents than any other city or town, at 3,136. Drilling into that number shows that almost all of the decrease came from the under-18 demographic (a 2,955 loss).
One must consider, however, that in 2000, Warwick’s school-age children actually made up a smaller percentage of its overall population than was true of Rhode Island overall; some other explanation is necessary to explain Warwick’s below-average results. In other words, whether the children of Warwick grew up and moved away or some other demographic of adults left, it remains the case that Warwick is replacing families with children with families without children at an unusually rapid rate.
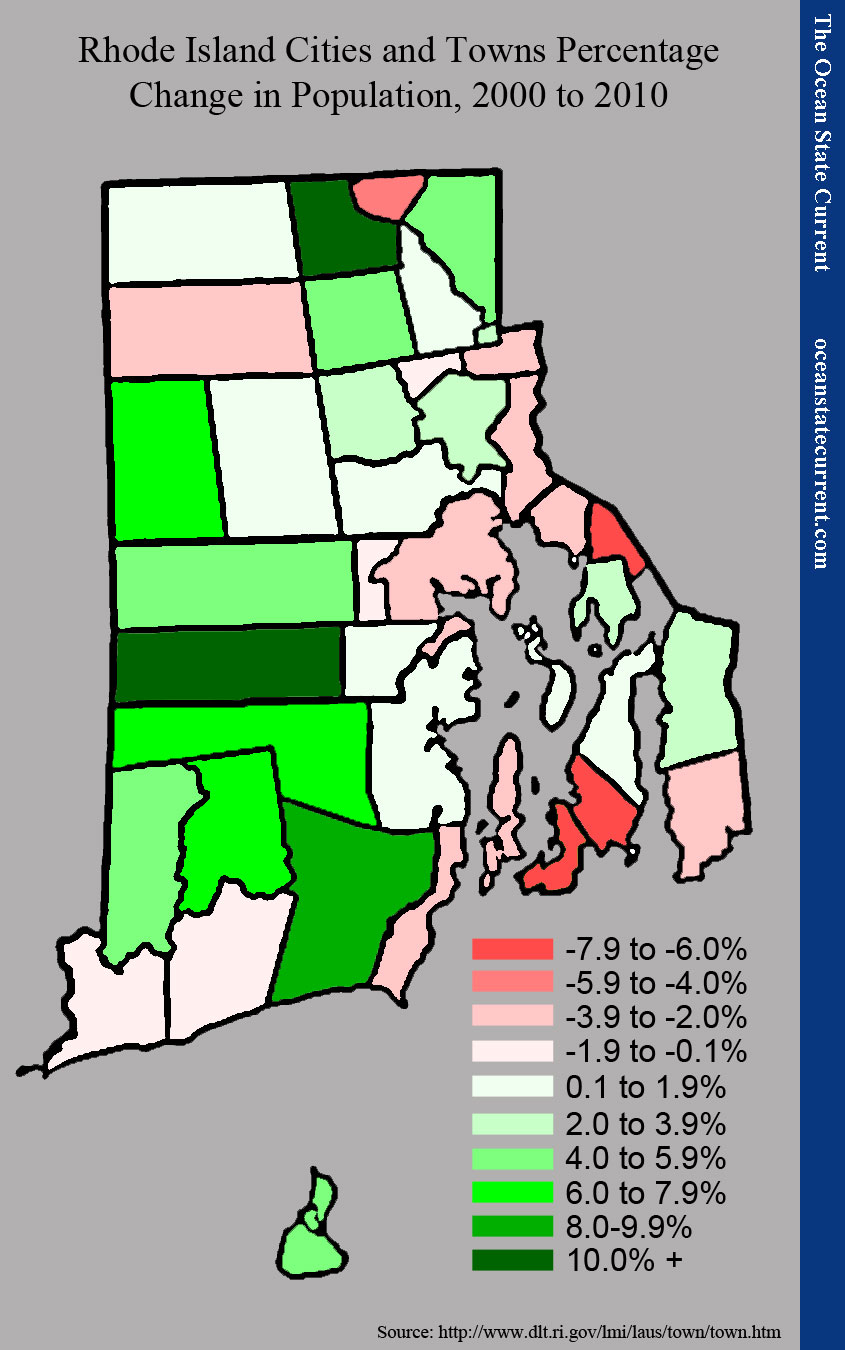
Reviewing the data in terms of percentage decrease (rather than the actual number of people) has the expected effect of mitigating the apparent changes of cities while emphasizing those of lower-population areas. Warwick (-3.7%), for example, falls from first place to sixth, after Newport (-6.8%), Middletown (-6.8%), Warren (-6.6%), Woonsocket (-4.7%), and Jamestown (-3.9%). Notably, apart from Woonsocket, the top 10 losses are all lower- and upper-bay communities, filled out with East Providence (-3.4%), Barrington (-3.0%), Narragansett (-3.0%), and Little Compton (-2.8%).
The other waning communities do share some of Warwick’s demographic shift, with school-age residents decreasing almost as much as the population overall. The notable exceptions are Middletown and Newport, where children accounted for less of the loss.
The more important distinction, though, comes in the bay-front towns that gained population: East Greenwich, North Kingstown, Portsmouth, Bristol, and Tiverton. All lost school-age population (especially Bristol), which suggests that something more is going on than mere “up and out” demographic shifts as children grow and move away.
Economics on the Bay
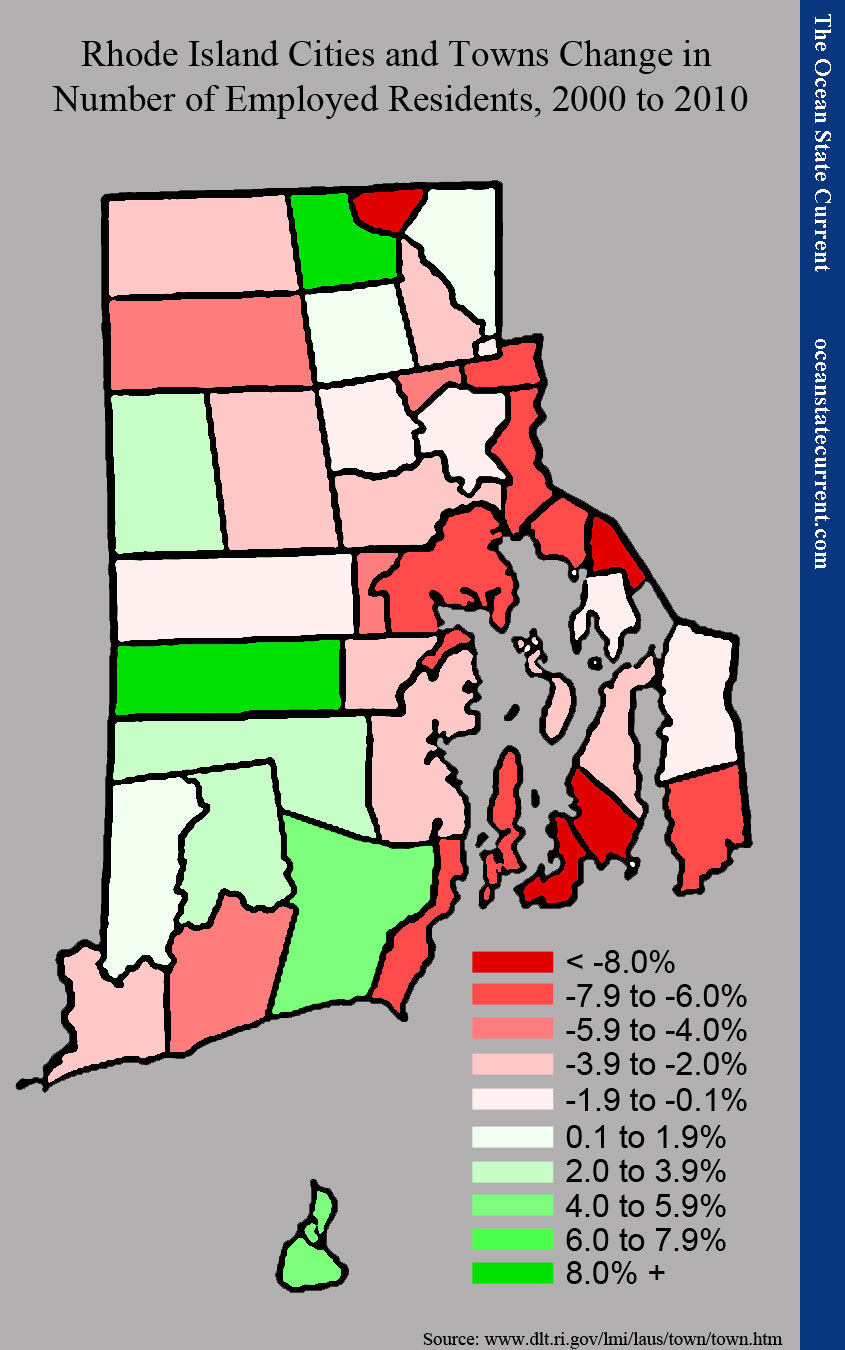
Warwick also led the state in the loss of employed residents, at 3,298. Viewing the employment declines in terms of percentage creates almost exactly the same top 10 list: Middletown (-10.3%), Newport (-10.2%), Warren (-10.0%), Woonsocket (-8.2%), Jamestown (-7.6%), Warwick (-7.2%), East Providence (-6.9%), Narragansett (-6.7%), Barrington (-6.6%), and Little Compton (-6.4%).
The five middle-bay towns that gained population in the midst of the state’s most-shrinking region were not immune to employment loss. But it’s interesting to note that the three that grew the least in terms of population fell farther in terms of employment. It appears that the people moving from one place to another were more likely to be (and to remain) employed; that is, more people moved to Bristol and Tiverton, and both towns held their employment pretty well, so the migrants appear to have brought their jobs with them.
Income Starts to Fill in the Story
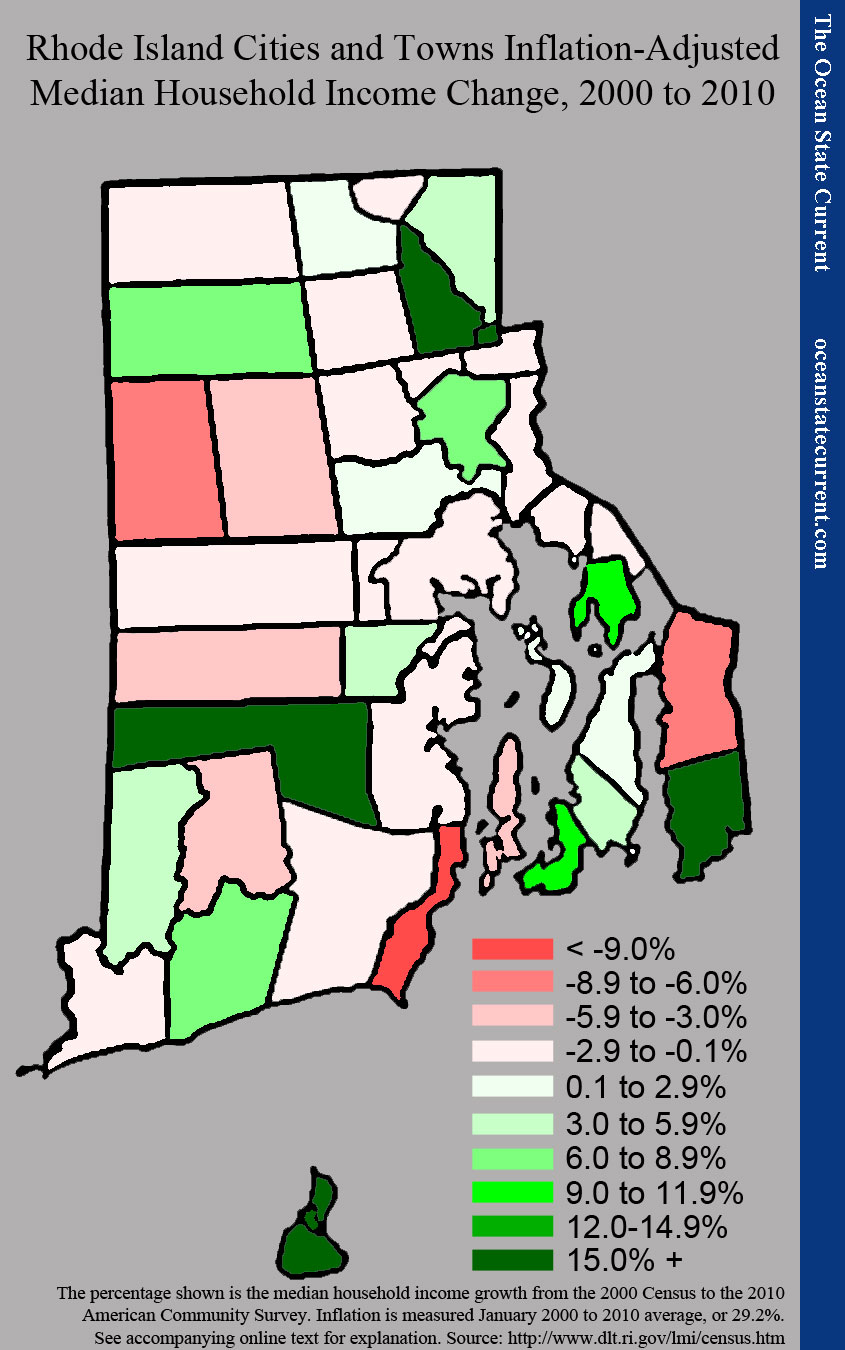
The discouraging observation when Rhode Island’s cities and towns are categorized by changes in their median income is that 22 out of 39 of them are not keeping pace with inflation (see the inflation note below). While no community saw its median income go down in current dollars, in terms of the buying power of that income, the majority were poorer in 2010 than they were in 2000.
The exceptions are where the story really begins to gain its color.
With the exceptions of North Providence, Pawtucket, and East Providence, the capital city and its surrounding ring saw overall population increases, with decreasing numbers of children. Yet, all these cities saw their number of employed residents decrease. The pattern of more population and less employment extends north to Lincoln and Central Falls (which also was unique in gaining children).
Despite this trend, the urban ring’s median incomes actually kept pace pretty well with inflation. Cranston and, especially, Providence, were wealthier communities in 2010 than they were in 2000. One step to the north, Lincoln and Central Falls were actually two of the most improved municipalities in the state. To be sure, Central Falls is still the poorest city in Rhode Island, and Providence is still the second-poorest, but the gaps are closing.
Combining these trends, the explanation can only be that residents who remain employed in this area are making even greater strides.
Meanwhile, by the bay, the municipalities that saw the greatest population and employment declines, Newport and Middletown, experienced very healthy increases in median household income. One explanation would be that these two Aquidneck Island communities have residents in industries that have weathered the recession especially well. More likely, perhaps, is that a thinning population of working and middle-class families who could no longer afford the inflating housing prices sold their property to wealthier (and smaller) families and, overall, increased the relative weight of the island’s extremely wealthy contingent.
A more intriguing comparison arises between Bristol and Tiverton. Both gained population, and both held their employment reasonably well. But Tiverton experienced the second biggest real income drop in the state (after Narragansett), while Bristol’s median increased significantly.
In relative wealth across the state, Bristol climbed from 29th to 24th, while Tiverton fell from 23rd to 26th. Familiarity with the two towns suggests a possible interpretation: Bristol may have exemplified the model of lower-income families with children being replaced by wealthier households without them, as in Newport, but having the capacity to make room for more.
Tiverton, for its part, appears to have attracted a more working-class population. Despite being more rural than Bristol, it gained more population, and proportionally, it lost fewer children. Tiverton might, therefore, be the prime example of the Rhode Island community toward which young families have retreated.
Part 3 will step back for a broader suggestion about Rhode Island’s population trends.
Note on inflation: At the time of writing, the data available for 2000 is from the U.S. Census, and the median household income number represents what people said they made in 1999. The 2010 income data, by contrast, is from the 2006-2010 American Community Survey 5-Year Estimates report and represents what people said they made in the previous twelve months, inflation adjusted to 2010 dollars. To best align these results with inflation over the decade, The Current calculated the inflation from January 2000 to the 2010 average.


