A Racist Disease (?) and Games with Models, 5/7/20 Data
We live in a world where some would insist that it is racist to say that it’s wrong to inject race into every public discussion, but doing so very often obscures more than it reveals. As with claims about gender differences in pay, observed discrepancies often have more to do with things that are only incidental to racial groups.
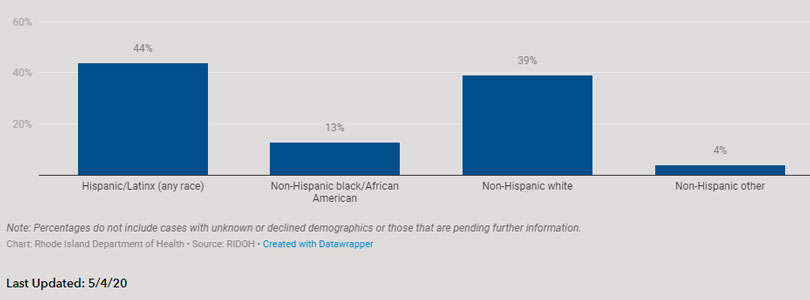
Consider talk about racial disparities in COVID-19 infections. Among the state Department of Health’s regular charts reporting daily results is one divided by race, and many have commented on the fact that a full 44% of all cases have been found among people identifying as Hispanic. Even though they only represent around 13% of the population, Hispanics account for 44% of all positive cases of COVID-19. Central Falls, which is around 66% Hispanic, leads the state in the number of cases of COVID-19 per capita, at 2,595 per 100,000 residents.
But focusing on race doesn’t tell us much about the disease, or even about discrimination. Mostly it seems to be evidence that communicable diseases are especially dangerous to places that are densely populated. In those terms, Central Falls is by far Rhode Island’s most densely populated city, at 16,147 people per square mile. (The city is pretty much just a square mile.)
So, if we recalculated to rank our cities and towns by cases per person per square mile, Central Falls drops to 32nd in the state. Providence becomes number 1 in the state by that method, but it is followed by Burrillville, North Kingstown, Smithfield, and Exeter. That isn’t exactly a racial profile. And it isn’t a close thing. Burrillville has 0.25 cases per person per square mile to Central Falls’s 0.03.* Given its density, Central Falls is doing very well.
“But,” the progressives will say, “the racist part is that we’ve isolated this one group in a densely populated area.” Leave aside the fact that progressives have tended to want people to condense into urban areas, as well as questions of whether it is reasonable to blame the decisions of those communities on people who make different residential decisions and whether any of this is a function of race so much as the length of time immigrant groups have happened to be establishing their families in the area.
The key point, here, is that the most important bit of information we can know at the moment is how the disease is spreading and who is vulnerable. Introducing race where population density provides explanation is a distraction, and distractions while dealing with a crisis can be deadly.
For further illustration of the point, return to the Dept. of Health’s race-based chart, and instead of looking at cases, click “hospitalizations.” Whereas Hispanics account for 44% of all cases, they only account for 33% of all hospitalizations. Even more striking: their percentage of fatalities is exactly in line with their percentage of the population: 14%.
In contrast, Non-Hispanic whites account for 79% of all deaths, despite being only 74% of the population. Of course, this is because the disease is almost exclusively fatal to older people, and they are more likely to be white in Rhode Island, right now. Would anybody claim that racism is to blame for this outcome, by concentrating our white people into nursing homes?
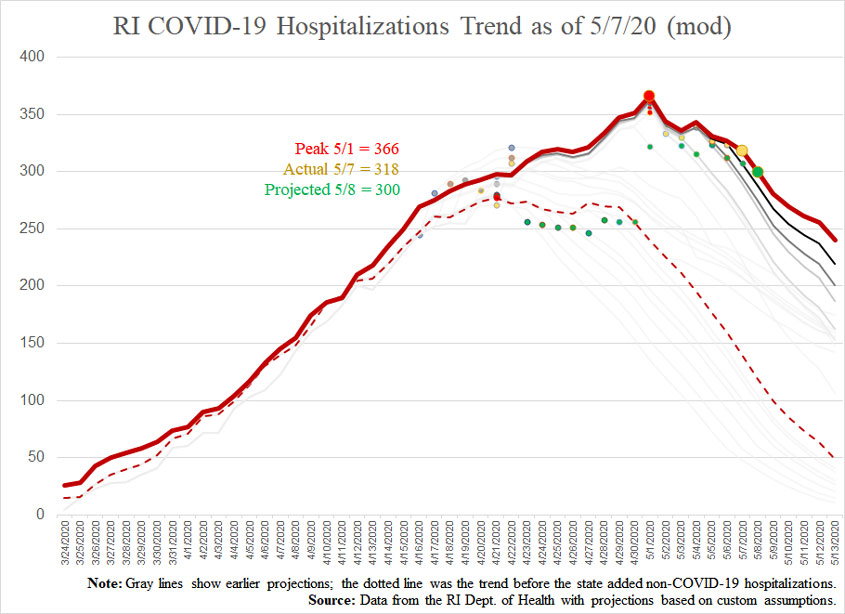
Turning to the regular COVID-19 report, trends are more or less as they had been. Although the one-day increase in cases was significantly higher than it’s been in a number of days, the trend is still downward, as it is for hospitalizations and intensive care unit usage. Meanwhile, the number of deaths is not improving as quickly as anybody would like.
- Cases:
- Projection for 5/7: 10,371
- Actual for 5/7: 10,530
- Projection for 5/8: 10,694
- Hospitalizations:
- Projection for 5/7: 307
- Actual for 5/7: 318
- Projection for 5/8: 300
- Deaths:
- Projection for 5/7: 376
- Actual for 5/7: 388
- Projection for 5/8: 394
* In the spreadsheet built for comparisons of density, I had a column multiplying my cases per person per population calculation by 100 to get it out of decimals as I reviewed the data. In transcribing that number to text for this post, I didn’t account for this change.