Games with Models, April 22 Data
During her daily video statement today, Governor Gina Raimondo pronounced the “good news” that things seem to be leveling off in Rhode Island. Based on my model, today was the peak for active cases. (See here for the methodology.)
In the comments to yesterday’s post in this series, Mario pointed out that the state isn’t just updating its totals each day, but rather revising data going back. So, the first chart in today’s post is a correction for yesterday:
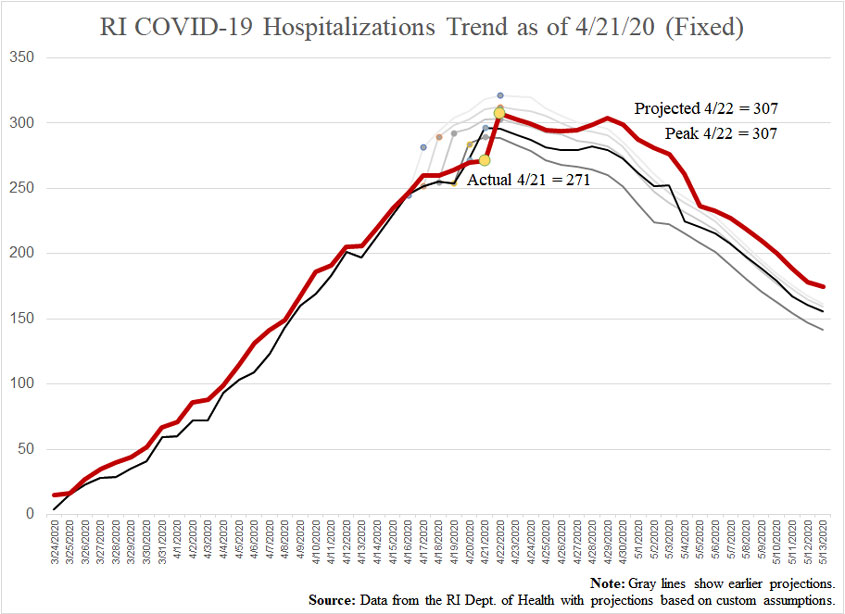
Basically, the corrected data bumped the totals up a little and expanded out the downward slope. Although my projected peak increased by five hospitalizations, the model still placed it today.
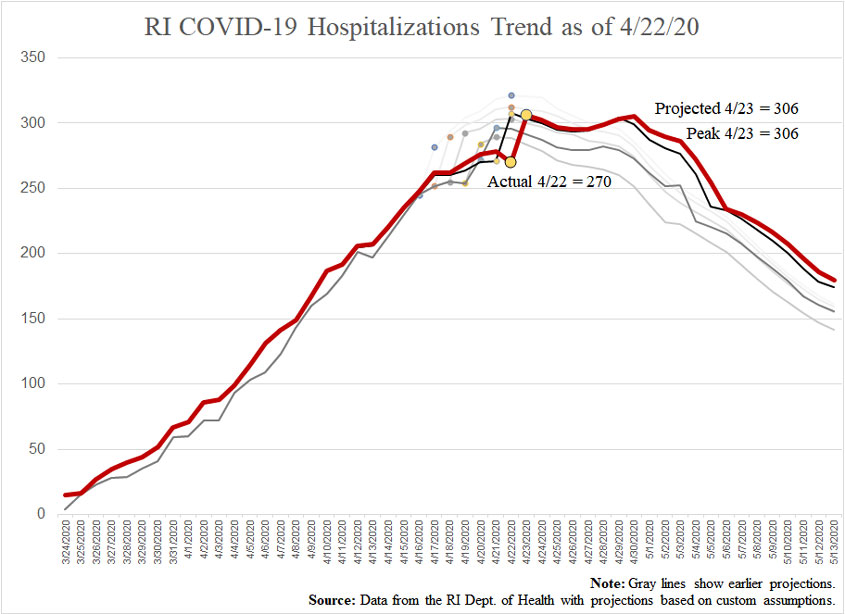
Happily, that did not happen. The number of reported hospitalizations actually went down, rather than shooting up. As you can see, hospitalizations went down substantially more than the day-to-day reports suggest because the state is now saying the past two days of reports should have been higher. (Another note courtesy of Mario is that the hospitalization data is two days behind the other metrics.)
Compared with the numbers in yesterday’s post, the three key metrics current stand thus:
- Cases:
- Projection for 4/22: 5,731 (uncorrected)
- Actual for 4/22: 5,841
- Projection for 4/23: 6,083
- Hospitalizations:
- Projection for 4/22: 302 (uncorrected)
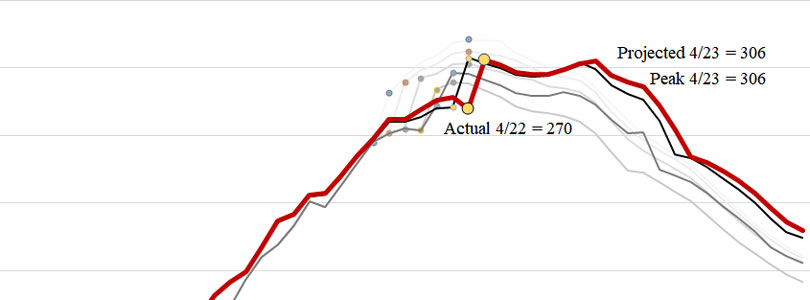
- Actual for 4/22: 270
- Projection for 4/23: 306
- Deaths:
- Projection for 4/22: 178 (uncorrected)
- Actual for 4/22: 181
- Projection for 4/23: 189
The corrected data suggests an important consideration. For most of last week, the daily actual number of deaths was in double digits, up to 20 people. The past three days have been single digit, which is a more-hopeful sign than the data above might suggest.
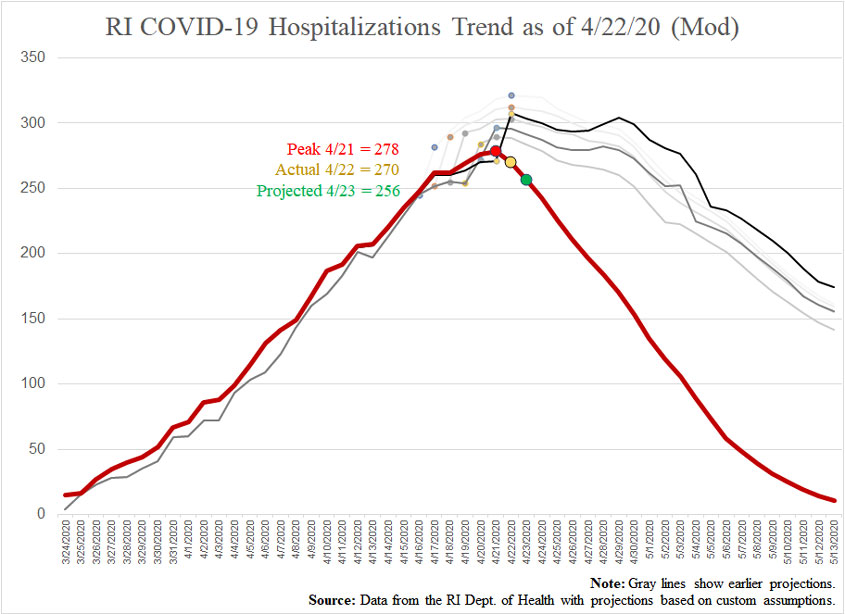
Another important note is that the big surge in cases I’ve been projecting for the day following each update is a function of the methodology. It assumes that the ratio of the total number of people who have ever been hospitalized for COVID-19 in RI to the total number of people who have ever been diagnosed with it would stay pretty steady. That is not looking accurate, inasmuch as the ratio has been falling pretty quickly — by about three percentage points per week.
To adjust for that, in the following chart I reduce the ratio each day by the compound daily growth rate for the past two weeks (i.e., how much the ratio has gone down each day on average for 14 days). Under this scenario, yesterday would have been the hospitalization peak and tomorrow’s report will be 256. I may run both charts for a bit to see how things go.