In RI, Hispanics Lag on NAEP and Whites Lose Ground
The RI Center for Freedom & Prosperity’s interactive application for reviewing data from the National Assessment of Educational Progress (NAEP) gives users an easy way to see how students in their state are doing from a number of angles.
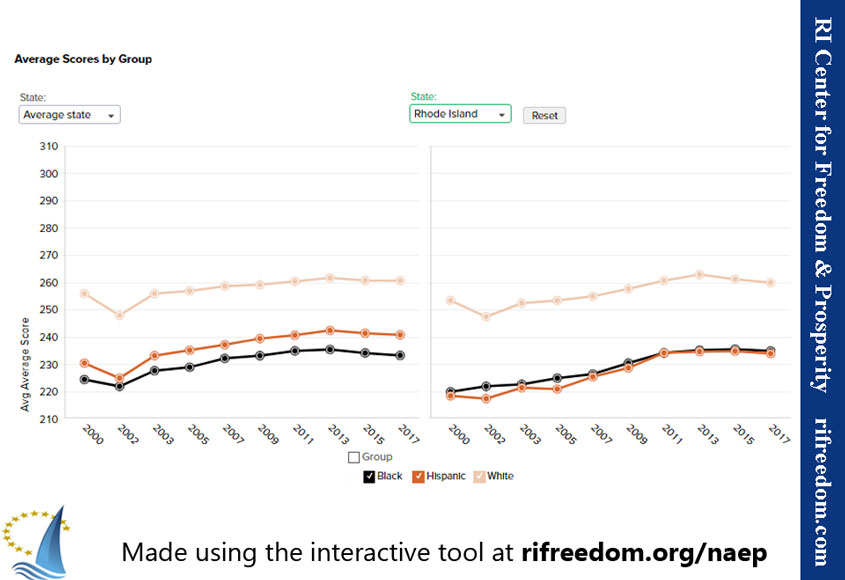
One angle that seems of particular concern in discussions about education has to do with race, and Rhode Island’s results are somewhat unique. The top line in the following chart shows that the demographic majority, white students, is on a down-slide when 4th and 8th grades and math and reading scores are averaged and combined. For the average state in the country, at least this group is holding more or less steady.
The story for black students is somewhat the reverse, with this demographic group holding steady in Rhode Island but sliding nationally. As a result, in 2017, black students in Rhode Island actually outperformed the national average. Of course, this cohort unfortunately remains well below white students.
The big difference comes with Hispanic students. Across the nation, Hispanic students trend a bit higher than black students. In Rhode Island, the two groups have been tracking pretty much along the same path since 2011.
[box type=”note” style=”rounded”]To Our Readers: We need your support to challenge the progressive mainstream media narrative. Your donation helps us deliver the truth to Rhode Islanders. Please give now.[/box]