April 2014 Employment: Still Booming… Inexplicably
If you want a patina of positivity on Rhode Island’s employment picture, it’s there.
The unemployment rate is down, even with labor force growth. Both jobs and employment were up in April, with the latter continuing an apparent boom and the former reversing from negative territory last month.
Last month, I put the employment boom in context of state income tax revenue. This month, Ted Nesi does the same, noting that “reported income-tax withholding payments are 2% higher than expected through the first 10 months of the 2013-14 fiscal year.”
It’s that last point that has put me so far behind today. Do I have to reconsider my skepticism? Is this the elusive evidence that the employment numbers aren’t just experiencing their annual mammoth overstatement (exacerbated by the fact that it’s a critical election year for the Obama administration), with a corresponding revision downward predictably on the calendar for next January?
The problem with these statistics is that, as we get to finer and finer analyses — looking for a bump in paycheck withholding from the state to correspond with survey data about employment — we have to be more specific about the numbers. The employment figures that we all talk about are seasonally adjusted, so the BLS statisticians smooth them out, meaning that they don’t directly correspond with the feedback they get from the public. Meanwhile, the 2% higher withholdings Ted cites are a comparison of actual revenue with the guesses of the state’s economists. That could mean only that the economists were 2% too pessimistic.
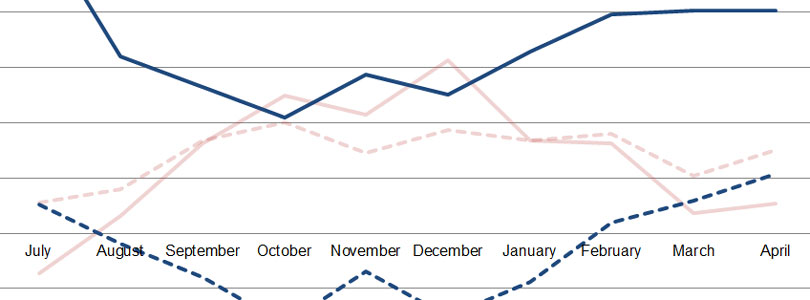
Instead, we should try to stick to actual revenue numbers and not-seasonally-adjusted employment data. If we look at how much bigger (or smaller) withholdings and employment were in a given month this year than in the same month the previous year, we get the following chart.

I made the lines for fiscal year 2013 very light because they aren’t my main concern, here, but I wanted to illustrate that the lines for income tax withholdings and employment do, in fact, tend to have similar shapes. A variety of factors prevent them from being parallel, but the echo is definitely visible. The same is true for FY14… right up to this inexplicable employment boom from February through April.
For those three months, withholdings (the solid blue line) have been virtually flat, compared with last year, while employment (the hashed blue line) has taken off.
Another interesting tidbit (though I’ll have to leave it for later to explore) relates to my running hypothesis that the shrinking margin between Rhode Islanders who say that they’re employed (on one hand) and jobs that are based in Rhode Island (on the other) has much to do with the loss of innovators and entrepreneurs — the self-employed and independent contractors. As Ted notes, withholdings from employees’ paychecks are 1.9% higher than expected, so far this year. But the estimated payments that people are supposed to make when nobody withholds taxes from their income (i.e., when they’re self employed) are down 4.9%.
Obviously, that’s not conclusive, but it definitely suggests that either my hypothesis has some bugs or the numbers do.
While I’m on the topic of jobs based in Rhode Island, it’s worth taking a look at that particular bright spot in the employment report. The RI Dept. of Labor and Training press release crowed that, after the 800-job drop in last month’s release, April brought “a gain of 700 jobs from the revised March employment estimate.” That would be encouraging, indeed, if it weren’t for the fact that the “revised” number for March is 500 lower than was originally reported. In other words, the drop in March was actually 1,300, not 800. The 700 doesn’t look quite as encouraging in that shadow.
Now, on to my monthly charts. The most basic one shows, once again, why I have such doubts about the employment data. If you believe the numbers, in just the last three months, we’ve overcome two years of humped stagnation. If this keeps up, by mid-summer, employment will be back to where it was in autumn 2008.

Of course, what’s keeping us last in the nation is that most other states are experiencing the same miracle. Here we are in context of our two neighboring states.

If the numbers are accurate, there’s another note of positivity in the fact that we’ve edged a little closer to our pre-recession peak employment than Michigan, which we had overtaken for last place by this ranking a few months ago.

Similarly, we’ve seen gains in employment compared with the end of the jobs recession in February 2010… but then again, every state is now in positive territory by this measure.

And saving the best for last, here’s the summary chart of the employment numbers compared with the RI-based-jobs numbers. In terms of the discussion with which I began this post, under my thesis, the small growth of the lighter area — that is, people working for other people within the state of Rhode Island — would contribute to small growth in income tax withholdings. That is, in fact, what we see.
Meanwhile, the boom in the dark area — people who say that they are employed but aren’t counted in the first group — would result in a boom in estimated tax payments. That, we don’t see.
There may be some slack, in that latter expectation, since not every person striking out to work for him or her self will get on board with the whole “estimated payment” thing until having been hit with a big penalty at the end of the year for not giving the state its interest-free loan from his or her paychecks. Even so, the fact that state tax revenue from estimated income tax payments is actually down from where it was last year is not an encouraging sign.

