April 2020 Employment: COVID Flips the Table
The humdrum notch-by-notch nature of these regular employment reports is now gone. Granted, one could take a little bit of the edge off the results in the charts that follow by observing that most of the people not working received (or will receive) a check from the federal government and many have been collecting enhanced unemployment checks from the state, but that doesn’t change the shock of the numbers. Moreover, those “solutions” come with problems of their own. Business owners are facing tremendous losses, and eventually the extra money will run out, perhaps with no jobs to return to.
We can hope the numbers bounce back more quickly than they did from the Great Recession, at least in Rhode Island, but that remains only a hope. We’re in completely uncharted waters.
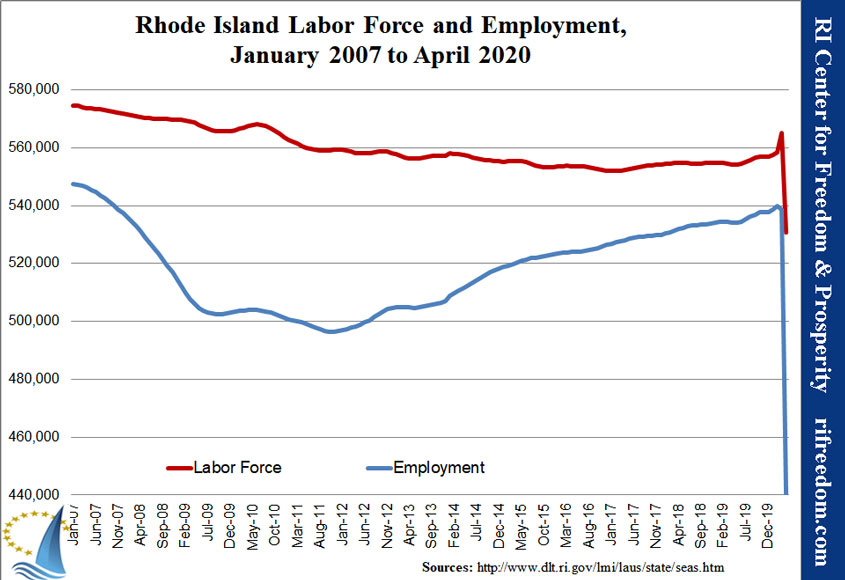
First up is the chart showing actual labor force and employment. In case it isn’t clear, the employment line just about touches the lowest line on the chart.
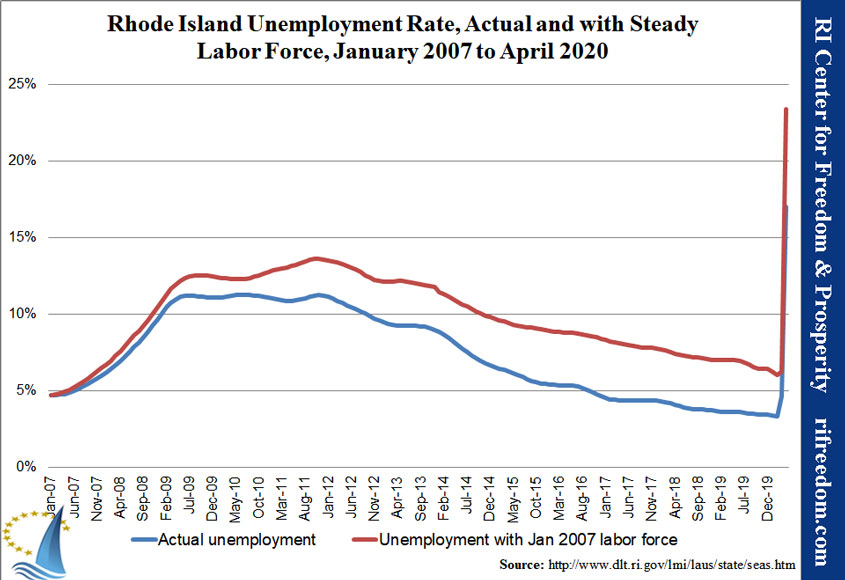
Partly just to maintain consistency, here is the chart showing what the unemployment rate is and what it would be if Rhode Island’s labor force hadn’t shrunk after the Great Recession. the actual unemployment rate is 17.0% (the highest on record). Had the Ocean State not spent the past dozen years shedding people who say they’re looking for work, the unemployment rate would be 23.4%.
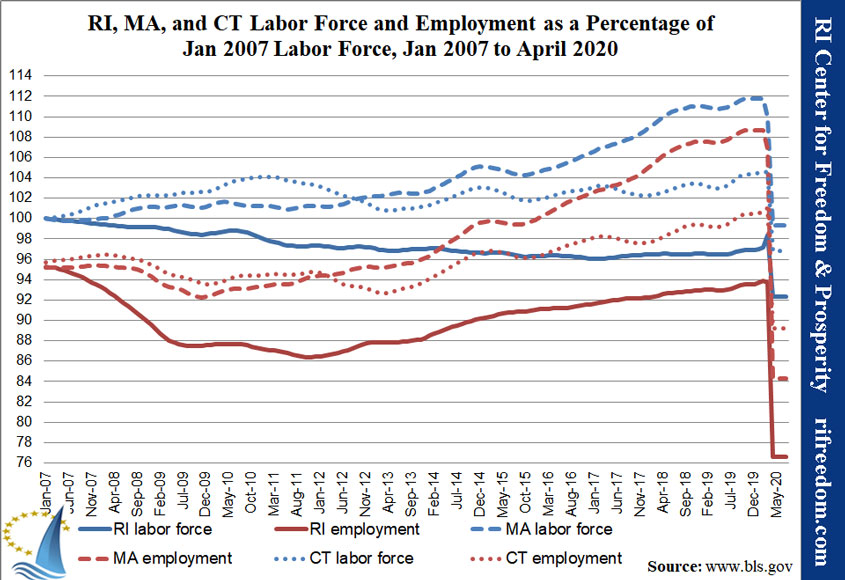
Perhaps we can take some comfort in the fact that the pandemic and the related panic didn’t just afflict our state. As the following chart shows, our neighbors, Connecticut and Massachusetts, also saw dramatic drops in employment and labor force, although Rhode Island continues to lag both of them, despite both states’ dealing with higher infections, at least in certain areas. (On this one, I extended the data out a couple of months so each state’s position this month would be visible.)
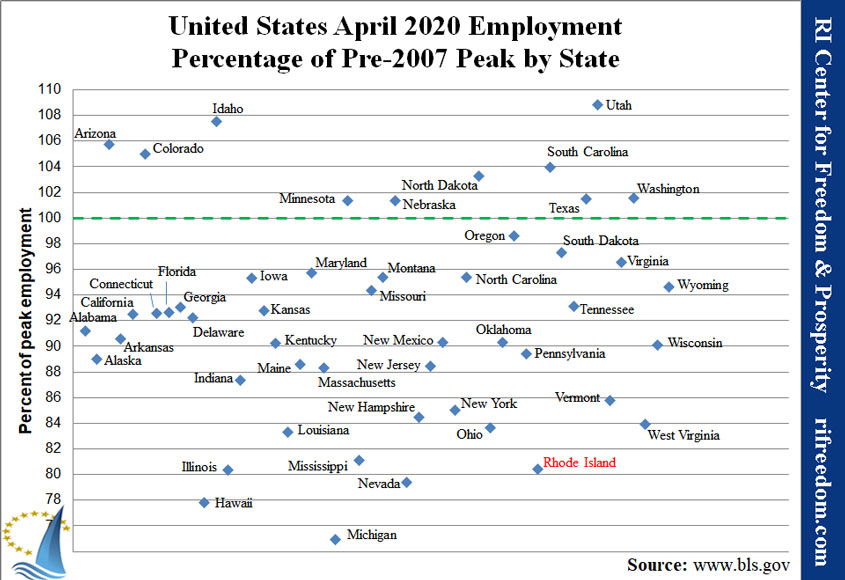
Along similar lines, the number of states that fell below the level of their peak employment prior to the 2007/2008 recession increased dramatically, giving Rhode Island more company in that club. Of course, the fact that Rhode Island had never actually achieved the 100% milestone puts us in a bad position to deal with this new crisis. It’s notable that 10 states did not (at least not yet) backslide all the way past the prior recession.
Going forward, it may make sense to reset the “100%” to account for the fact that most states had new peaks, but for now we’ll just see how things go.
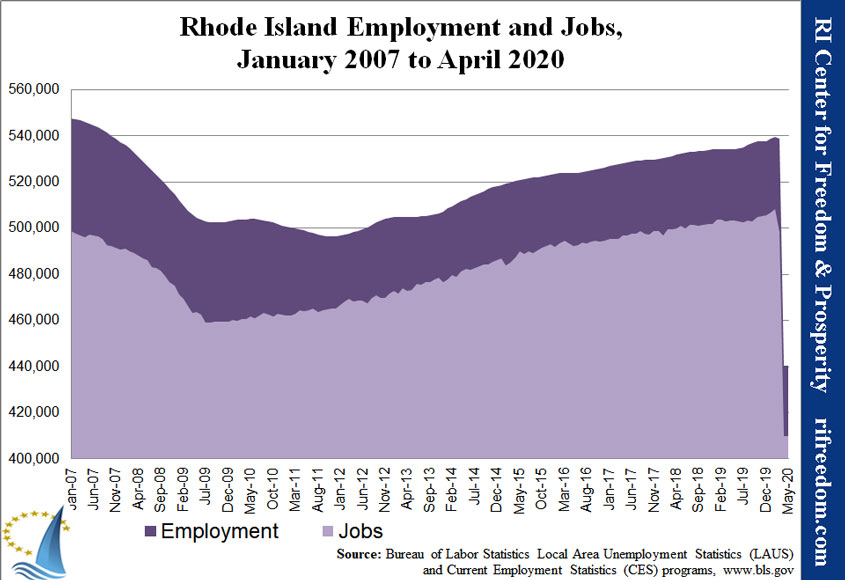
The final chart for this series adds the number of RI-based jobs to the mix (the lighter area). In this case, Rhode Island had (just barely) replaced all those lost during the Great Recession, but the bottom fell out there, too. The question of the next few years (or decades, given RI’s ordinary pace) will be how many of those come back.