Digging in on Graduation Data
Naturally, I couldn’t leave the unsatisfying ambiguity of yesterday’s post about Rhode Island graduation rates alone, so I kept playing with the available data. It’s missing some key data points that play into the graduation rate — such as the number of students transferring into and out of public schools (whether private or out-of-state) and students who repeat grades — but the numbers do tell an interesting story.
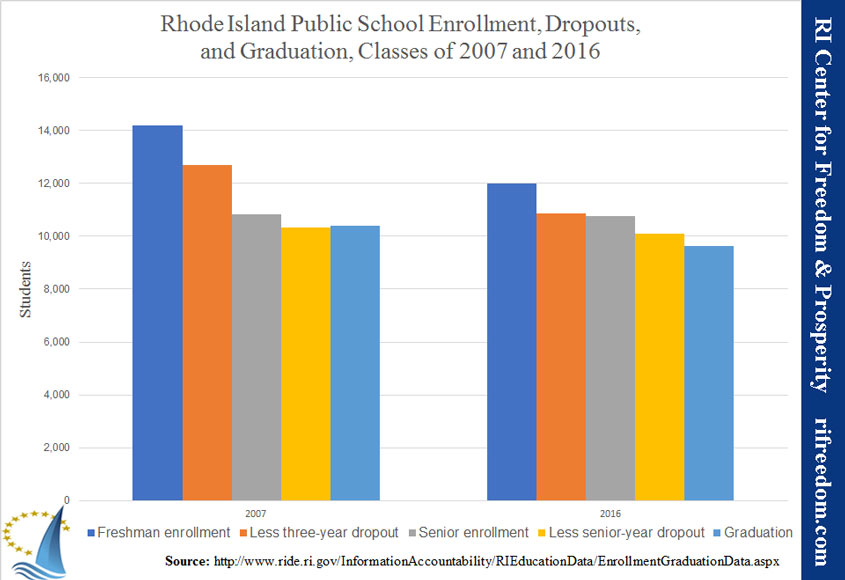
This chart shows the classes of 2007 and 2016 at several points in their travel:
- Enrollment as of October of their freshman year
- The same number minus those who drop out freshman, sophomore, or junior years
- Enrollment as of October of their senior year
- The same number minus those who drop out senior year
- Graduating class
The first observation to jump off the chart is the starting decrease of 15%. Counting kindergarten, there are 13 grades, which means each grade is approximately 7.7%, so the freshman-year enrollment has lost very nearly two full grade levels worth of students. (At the same time, as I’ve noted in Tiverton, far from going down accordingly, budgets have continued to climb.)
As we move into the more subtle observations, one positive note is that our government schools are doing a better job of keeping students from dropping out during the first three years of high school. As a percentage of their starting freshman class, pre-senior dropouts have fallen from 10.4% to 9.6%.
That helps to explain why enrollment in senior year has barely dropped at all over the decade (less than 1%), but a more significant point may be related to my previous arguments that the government has been targeting the private-school market to keep up its own student numbers. One mechanism for doing so has been charter schools, but other policies push toward the same end. For example, students in public schools can attend college-level courses and take the SATs on the taxpayer’s dime, but private school or home-schooled students cannot. In 2007, more than 13% of the drop from freshman year to senior year could not be explained by dropouts; in 2016, that percentage was less than 1%. In other words, the net effect of students’ transferring into and out of government schools during the first three years of high school is now almost nothing.
Next, although government schools are doing a better job of keeping students in school up to their senior year, that gain is lost (and then some) during the final year before graduation. In 2007, 4.8% of the starting senior class dropped out; in 2016, the number was 6.1%. Consequently, the percentage of students enrolled for freshman year who drop out before graduation has increased, from 14.1% to 15.0%. (Of course, that’s based on a dramatically shrinking starting point, so the number of dropouts over the four years of high school has actually gone down.)
The size of the graduating class, therefore, has shrunk, by 7.4%, from 2007 to 2016. The number of students graduating was 4.2% smaller than the number enrolled as seniors at the start of the 2006-2007 school year, whereas the 2016 the graduating class had shed 10.5% of the students who’d begun senior year.
Overall, the impression one gets is that the government is increasingly emphasizing not only keeping kids in school, but keeping them in government schools. When that drive hits a crisis point for some students — as they have to get over the hurdles to graduate — a greater percentage are dropping out or pursuing alternatives among strangers for their final year of secondary school.
In that environment, it’s not unreasonable to wonder how many students are simply being pushed along and handed diplomas in order to drive the official graduation rates up, especially given the establishment’s visceral aversion to objective standards for a diploma.
