
February 2015 Employment: Seeming Up While Still Down
“For the first time since November 2006,” wrote Kate Bramson in Saturday’s Providence Journal, “Rhode Island doesn’t have the worst unemployment rate in New England.” Looking closely at the data, however, Rhode Islanders might wish the state did.
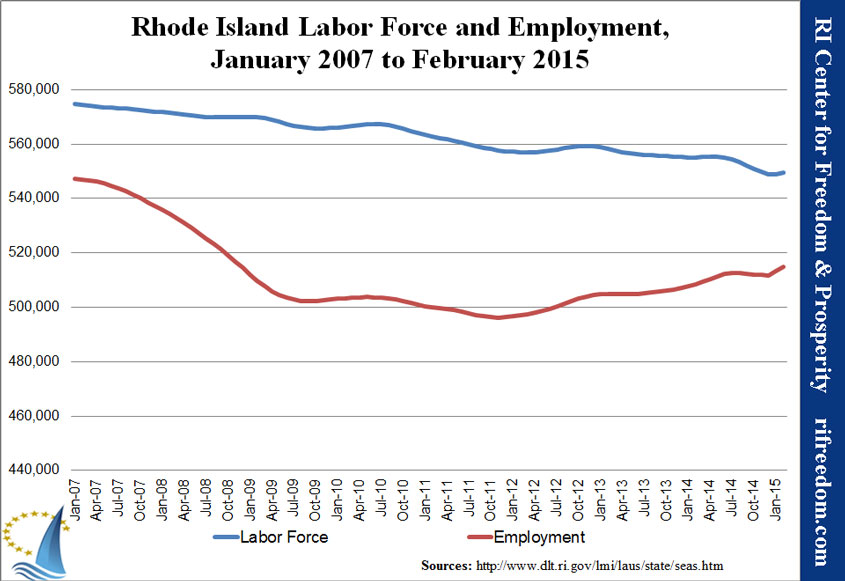
The reason has to do with the decline in the state’s labor force, which is the combination of people who say that they are employed and people who say that they are looking for work. As the following chart shows, employment has been edging up, while labor force has been drifting down.
Even with the same employment, if labor force had remained steady, the unemployment rate would be much higher. If the labor force had grown — if the Rhode Island economy were encouraging people to get out there and look for jobs — then the unemployment rate might even go up. And that would be a good thing.
For the Connecticut contrast, look to the dotted line in the next chart. In recent months, more people have decided to look for work in the Nutmeg State than were able to find jobs. So, even though that state’s employment record is much, much better than Rhode Island’s the gap between employment and the labor force is slightly higher.

The next chart gives the best perspective on employment. Rhode Island is still among a small group of outliers way down at the bottom of the chart, and while not every New England state has made it across the 100% line (meaning that it has recovered at least all of the employment that it lost in the recession), they’re all closer than the Ocean State. Notably, Connecticut is among the states over the 100% line.
Regarding this chart, by the way, a correction to the post on January data is in order. The revision of this dataset that the Bureau of Labor Statistics (BLS) released in January hit Mississippi hard, erasing nearly 25,000 employed people, or just about 2%. Because these posts attempt to keep the axes the same from month to month in order to make the charts more easily comparable, Mississippi had temporarily slipped off the bottom, and I didn’t notice it until this month, when the state made it back into sight.

A peculiar thing about recent data has been visible in the second chart above, comparing Rhode Island with its immediate neighbors. One of the factors that makes employment numbers different from jobs based in the state is that they include Rhode Islanders who are working elsewhere. Theoretically, then, with the big gains in employment in Massachusetts and Connecticut, one would expect employed Rhode Islanders to put some distance between themselves and the trend for RI-based jobs.
On the whole, they haven’t, although February gives a one-month example of how that might look.

