November Employment: Rhode Island’s Peculiar Growth Abates
After two months of unexpectedly strong employment growth, Rhode Island’s surge abated. Unemployment held at 10.4%, leaving the state at second worst in the nation, with Nevada rapidly making up the distance, and the number 3 California finally slipping below 10%.
According to survey data released by the U.S. Bureau of Labor Statistics, the pace at which increasing numbers of Rhode Islanders say that they are working fell to about a third of what it had been for September and October, to 1,501. Meanwhile the labor force increased by 1,411.
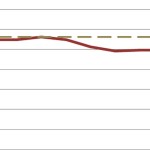
The following chart shows the dramatic leap up and subsequent leveling of labor force and employment, which are still well below their numbers before the Great Recession:

The following chart puts Rhode Island in the context of its two neighbors, with data for each state shown as a percentage of its level at the start of 2007. Massachusetts continues to hold its own, while Connecticut continues its free fall, following a year of decreased government spending and increased taxes. Regardless, barring dramatic improvement, Rhode Island looks likely to remain the bottom of Southern New England’s barrel for the foreseeable future.

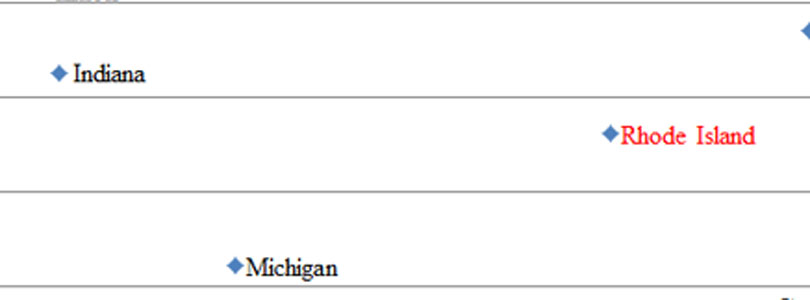
A national chart of states’ current percentage of their pre-recession peak employment shows Rhode Island still somewhat of an outlier, although Michigan is even more so. It’s interesting to note that all three states at the bottom of this chart — Michigan, Rhode Island, and Indiana — began 2012 as non-right-to-work states, but only Rhode Island will end 2012 without having passed (or even considered) right-to-work legislation. That may present an interesting comparison as policy in the other two states takes effect.

A final chart shows states’ progress since the nation’s employment collapse came to a decisive end, beginning February 2010. Clearly, Connecticut’s troubles have brought it low: Out of nowhere, the state went from positive territory to worst in the country in just a few months, a reverse of Rhode Island, which trailed the nation by an even greater degree prior to its unusual burst of employment.