November Employment: Up Month Continues the Servant Economy
Rhode Island has gotten a one-month reprieve, at least, in its march toward an even worse employment situation. The reduction to a 9.0% unemployment rate, however, was not enough to keep the state from tying Nevada for worst in the country, however.
The following chart shows that the state has pulled back enough, perhaps, to keep from ending the year with fewer people in the workforce than were actually employed in January 2007.

Nonetheless, a comparison with Connecticut and Massachusetts shows Rhode Island not to be gaining much ground, regionally.

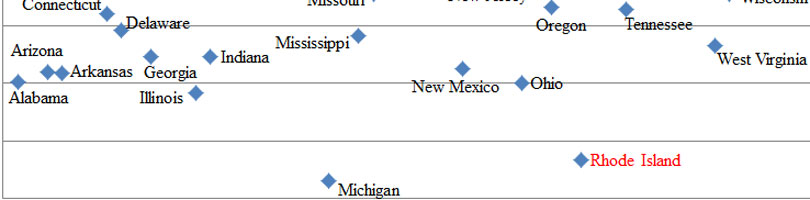
The chart of all states in terms of their distance from pre-crisis peak employment shows that, although Michigan lost some ground, in November, the other states toward the bottom of the chart increased their distance from the two outliers — Michigan and Rhode Island. In fact, the national average increased almost one-quarter of a percentage point to 98.24%.

Rhode Island also remains one of just five states that currently have fewer employed residents than in February 2010, when the national jobs recovery began in earnest.

One final chart that we’re adding to our monthly rundown shows Rhode Island’s number of employed residents in comparison with the number of jobs based in the state. As explained in a prior post, the most significant difference between the darker area, versus the lighter one, is that it includes business owners, contractors, and the self employed.
Although both numbers went up in November, the gap between them actually narrowed, which could mean that a higher percentage of all people who are working are working for somebody else. Put differently, rather than a “service economy,” Rhode Island may be fostering a “servant economy,” in the sense that more Rhode Islanders’ careers are dependent upon an employer, rather than directly on clients.

