October Employment: Boomtime in Rhode Island?
Rhode Island’s employment results, as reported by the U.S. Bureau of Labor Statistics (BLS), would surely surprise the tens of thousands of Rhode Islanders who are struggling to survive the state’s continuing downturn: For the second month in a row, the Ocean State led the nation in employment growth. The state still has the second worst unemployment rate, and it is still the second farthest state from its pre-recession peak, but the gap — huge as it became — is closing.
To be specific, the Local Area Unemployment Statistics numbers derive from surveys that the BLS conducts on a running basis, asking residents various questions about their employment and unemployment status. The employment numbers stated below are those respondents who say that they are working, full or part time. The labor force adds to these people those who say that they are not working but have looked for work in the past four weeks.
Except as otherwise noted, all of the data presented here is seasonally adjusted. That means that the BLS added or subtracted a “typical” change in the numbers for that particular month in order to make longer-term trends more visible.
This first chart shows that Rhode Island’s employment and labor force growth over the past two months has been stronger than it’s been since the recession began — by 9,224 people, or almost 2%. However, it also shows that the state has a long, long way to go before it has fully recovered.

The next chart shows the same results as a percentage of the January 2007 numbers and puts Rhode Island in the context of Massachusetts and Connecticut. Sources in Connecticut tell me that their state’s precipitous drop is attributable to the completion of government stimulus projects. Be that as it may, Rhode Island will have to experience many months of record employment growth to catch up with the two states that surround it.

Expanding the context shows that Rhode Island also remains an outlier on a national scale in terms of its distance from its pre-recession peak in employment.

The one area in which Rhode Island’s astonishing employment growth has brought the state across a threshold is in the employment comparison with February 2010, when the national jobs freefall ended. When I first made this chart, using July data, Rhode Island was one of only three states that had lost ground since early 2010, and it had lost more employment than the others, by far. Now, we’ve at least crossed into positive territory.

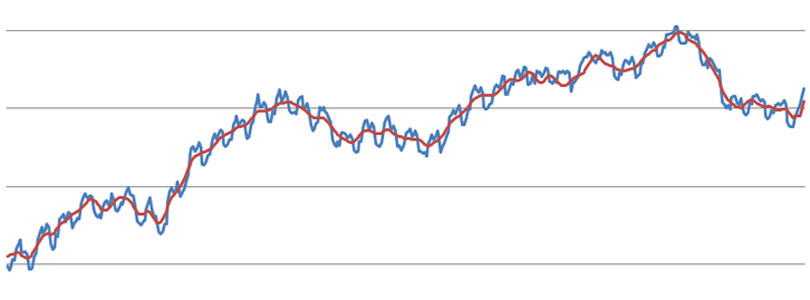
Because these results are so surprising, I’ve added another chart to my usual series, this month, this one showing monthly employment numbers seasonally adjusted (red) and not seasonally adjusted (blue). The final blue upswing shows that the unusual jump in employment in September and October has made this year’s unadjusted results look more in keeping with periods of strong economic growth — periods when there was no doubt that the economy was growing — than with the continuing downturn by which residents are still burdened.
It could be that the tremendous drop in employment in 2007-2009 has made even a boom feel like a blip, but until time brings clarity, the results remain odd.

Note:
Mainly out of amusement, I wanted to note a pair of numerical coincidences. As I noted in last month’s iteration of this information, employment had increased by 5,229. That was the preliminary result, before the BLS adjusted the number upwards. This month, the preliminary result is curiously close to that number, at 5,224. Additionally, September’s final number of total employment is 499,480, which incidentally rhymes (so to speak) with the August number of 495,480.