SNAP Data Sings the Rhode Island Tune
Last week, I noted that Rhode Island’s improvements in the Supplemental Nutrition Assistance Program (SNAP; aka food stamps) lagged those at the national level. I based that conclusion on the information available online, which wasn’t month to month, for Rhode Island, but year to year.
That day, I requested the month-to-month numbers, though. They’ve arrived, and the picture that emerges is more useful toward explaining Rhode Island’s predicament than I’d expected.
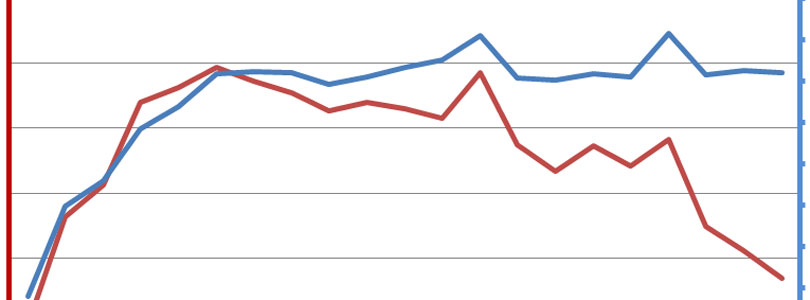
The first question on the table is whether there’s evidence for the employment boom that characterized the first half of the year, according to Bureau of Labor Statistics data. The short answer is, not really. The longer answer depends on how we look at the numbers. As the following charts illustrates, the picture’s shading depends a little on whether we look at households receiving SNAP benefits as opposed to the number of people actually covered.

For some perspective, according to the official data, 15,674 Rhode Islanders found employment between January and June of this year. Yet the number of households on the SNAP program stayed virtually the same, while the number of people on the SNAP program fell by only 2,039.
It could be that people are finding jobs that don’t earn them enough to disqualify them for SNAP, but the average household size for SNAP recipients is less than two people, so even a full-time minimum wage job should exceed that limit. If the employment numbers are accurate (which I don’t think they are), then it’s presumptuous even to call them “jobs.”
The second question, then, is how the number of households could remain steady while the number of people decreases. The most likely way that could happen is if the typical household size is shrinking. And indeed, the average household size was 1.76 people in June, down from 1.80 in October 2012 and 1.78 in January 2014.
This explanation finds further support in the fact that the total cost of benefits has been pretty much flat, this year, while the average benefit has gone up a bit. The way the program calculates benefits, each subsequent person in a household adds a little less to the total. In other words, a two-person household doesn’t receive as much in SNAP money as two one-person households.
If we want to find an explanation for this trend, the first thing to consider is that it is not national. As the following chart shows, while there is some difference in the households line and the persons line, the general trends are the same:

Together, the charts raise two questions:
- Why does the overall picture look different for Rhode Island than the nation as a whole?
- Why do the two lines have different trends within the Rhode Island charter, while they don’t within the national chart?
The basis for an answer to the first question probably must begin with the fact that SNAP benefits were reduced in November 2013. That might have increased the incentive for recipients to find some sort of job, which moved their households above the line for eligibility for the program. On a national level, of course, the data would continue to capture people and households who moved from one state to another for employment opportunities.
That possibility might form the basis for an answer to the second question. Families with children would have even more incentive to respond to Rhode Island’s languishing economy when facing reductions in government benefits. If we’re looking at just one state’s data, those larger households could come off the SNAP rolls not only by finding employment and losing eligibility, but also by moving out of the state.
Meanwhile, as the RI Center for Freedom & Prosperity’s Competitiveness Report Card for Rhode Island suggests, the Ocean State is notably generous with its social programs. It is hardly a new suggestion to speculate that being generous attracts to Rhode Island people who are inclined to look to the government for handouts.
Connecting the dots in this way obviously relies on a good bit of speculation. That said, when the same speculative explanation appears to fit every trend and quirk of every type of data, it starts to gain status as an operating theory. Namely, Rhode Island is giving productive people and growing families incentive to leave the state and contribute their talents and resources elsewhere, while giving people willing to take advantage of the system (one way or another) the ability to manipulate it.
Eventually, that imbalance will tip the whole arrangement, and everybody who remains in the state will suffer for it. Policymakers and voters should take careful note.
