State in Decline, Employment in RI Cities and Towns: Jamestown
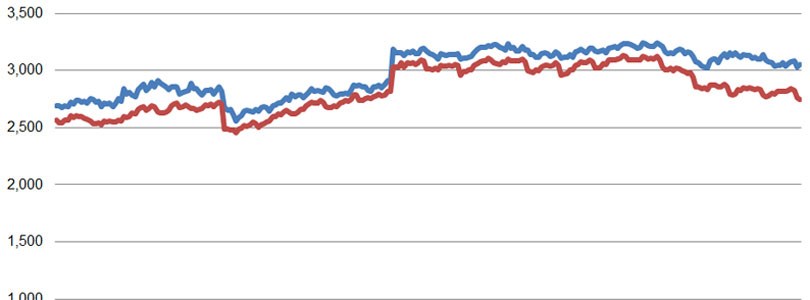
As with other very low-population Rhode Island towns, Jamestown’s employment data has to be viewed with an understanding that the survey samples are necessarily very small. The results, therefore, rely very heavily on the models designed by the U.S. Bureau of Labor Statistics (BLS). Evidence of the effect can likely be found in the two dramatic adjustments visible in the second chart below, which may result from alignment of the model with new survey data.
With that disclaimer duly considered, we can observe that all of the population and employment numbers are down in Jamestown, from 2000 to 2010. Population shrunk by 3.9%; the labor force (employed plus unemployed-and-looking) by 1.2%; and the total number of employed residents by a very high 7.6%.

Those trends left Jamestown with a seasonally unadjusted unemployment rate of 9.3% in March 2012. That’s still much better than the 11.8% for Rhode Island as a whole, but significantly above the nation’s 8.4%.
More notable, perhaps, is that the town’s total number of employed residents has deteriorated to within a few hundred of its level when the new Jamestown Verrazzano Bridge made crossing to the mainland a more fluid experience, in late 1992.

Note on the Data
The population data above comes from the U.S. Census conducted every ten years and is therefore generally considered reliable, to the extent that is used as reference for various government programs and voter districting.
The labor force and unemployment data, however, derives from the New England City and Town Areas (NECTAS) segment of the Local Area Unemployment Statistics (LAUS) of the federal Bureau of Labor Statistics (BLS). A detailed summary of the methodology is not readily available, but in basic terms, it is a model based on and benchmarked to several public surveys. It can be assumed that the sample rate (i.e., the number of people actually surveyed) in each Rhode Island town is very small (averaging roughly 30 people per municipality).
The trends shown, it must be emphasized, are most appropriately seen as trends in the model that generally relate to what’s actually happening among the population but are not an immediate reflection of it. Taking action on the assumption that the exact number of employed or unemployed residents shown corresponds directly to real people in a town would vest much too much confidence in the model’s accuracy.
Be that as it may, the data has been collected and published, and taken a town at a time, it is relatively easy to digest. So, curiosity leads the Current to see it as the best available data to deepen our understanding of trends within Rhode Island. If the findings comport with readers’ sense of how the towns relate to each other, perhaps lessons regarding local and statewide policies may be drawn. If not, then the lesson will be on the limitations of data in our era of information overload.
