Games with Models, May 3 Data
The best news today comes from the number of positive cases of COVID-19 in Rhode Island, which along with hospitalizations, suggests that we’re on the downward slope.
The best news today comes from the number of positive cases of COVID-19 in Rhode Island, which along with hospitalizations, suggests that we’re on the downward slope.
Rhode Island’s news media is reporting 17 more COVID-19 deaths, which sounds like a lot until you realize that, according to the state, only one of them was reported to have actually happened yesterday.
Revisions of COVID-19 hospitalization and death numbers going back weeks do raise questions, but trends continue to be generally positive.
Various bits of news are making the case that government COVID-19 statistics are now inflating the numbers, but even so, today’s report for RI has some good news.
The Dept. of Health’s big revision of COVID-19 hospitalization numbers raises doubts about the state’s numbers and (depending on the new methodology) might make hospitalizations useless for judging the danger of the disease.
Governor Raimondo wants Rhode Islanders to take on faith that she actually has the authority she’s wielding and that she’s basing decisions on “science,” but the public, and the news media, should not follow the cult of personality.
The situation continues to improve in RI, although not as quickly as we might like, and the trends in our neighboring states should not stop us from loosening the shutdown.
Today’s COVID-19 data release from the state government was along the same lines. The rate of increase of new cases continued to drop.
Despite a slight uptick in the number of hospitalizations, today was a very positive day for Rhode Island’s COVID-19 report.
Rhode Island took another step in the right direction with Sunday’s COVID-19 report, with hope rising that April 21 was the peak for hospitalizations.
Today’s COVID-19 report for Rhode Island came with a mildly better turn.
Although it’s still looking plausible that Tuesday was RI’s peak for COVID-19 hospitalizations, the steady increase in total cases remains a concern.
If we’ve found the steady rate of COVID-19 infections for our current level of lockdowns, that would point to the differences in models as well as the need to figure out what government is supposed to be for.
As data is corrected and Rhode Island rounds the peak for COVID-19 cases and hospitalizations, it may be time to adjust the projection methodology.
The emerging question when it comes to the daily data releases for COVID-19 in Rhode Island continues to be: which metric should we be watching? Today, the number of cases continued to outstrip my prediction as did, tragically, the number deaths. However, the number of hospitalizations, which is the focus of my model, went down one from yesterday and was, therefore, substantially lower than my prediction.
The reason the model I developed shows what looks like an upward correction and the predicted decline spreading out has to do with the number of cases. The rate of growth is slowing, but not as quickly as it had been, which means there are more “active” cases than expected, and that’s the foundation of my hospitalization predictions. (By the way, here’s the original post of this series, with my methodology.)

The three key metrics now look as follows:
The level of power Governor Raimondo is claiming for herself is huge, and it is noticeable in subtle ways. For example, in an article on GoLocal about how she’s had her hair done even as Rhode Islanders are prevented from doing the same, the governor tells “hairdressers, barbers, gig economy workers” to file for unemployment “until I can find a way to get you open safely.”
Notice that it’s all up to her. She is going to find a way. She is going to tell you when you can work again. If she is going to do that, she should give Rhode Islanders detailed information and data about how she is making decisions so we can judge for ourselves whether what she is concluding is reasonable or ridiculous.
Is the cure worse than the disease? Research Director Justin Katz of the Rhode Island Center for Freedom & Prosperity joins CEO Stenhouse on in “In The Dugout” to discuss the coronavirus crisis in RI. Katz is also the managing editor of the Ocean State Current, an he offers an analysis of the data of Governor Gina Raimondo’s data.
Of course, because the trend of this weekend was a leveling-off of COVID-19 hospitalizations, it was tempting to think we’d already hit the peak, and today’s increase to 272 people in the hospital proves that wasn’t so. Nonetheless, the increase was still less than my model had predicted.
(It bears repeating that these projections are based entirely on recent trends, so there isn’t any assessment of how viruses spread.)
For today, the model had projected 284 hospitalizations, and the actual number turned out to be 272.
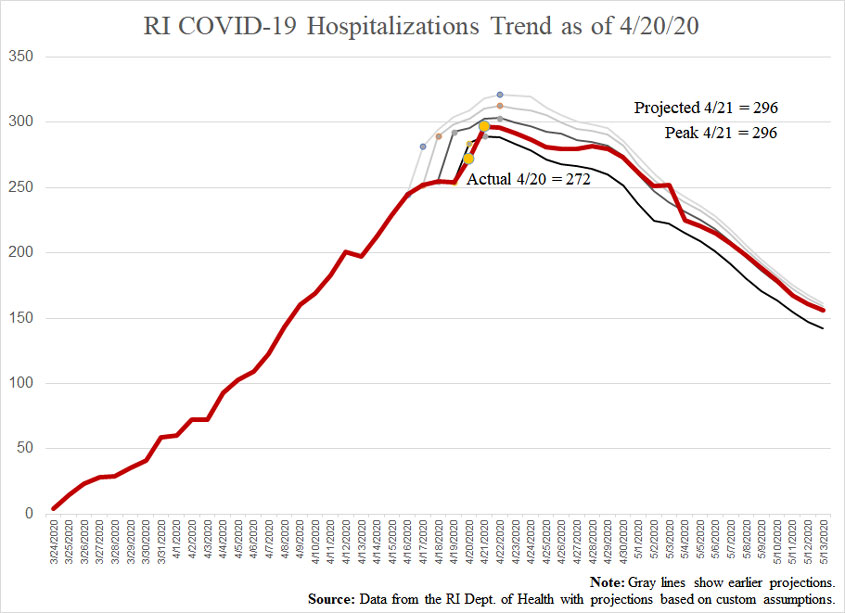
Here’s how the one-day predictions stacked up to reality and where they’re going next:
Naturally, to the extent that cases can follow a different trend than hospitalizations and deaths, it’s great to see the latter two going down. Increased testing would tend to mean we’re recording more cases leaning toward the less-serious side and would also tend to make the model overestimate for hospitalizations and deaths.
These trends move the projected peak of active cases to 4,082 tomorrow, with 1,067 Rhode Islanders’ having recovered.
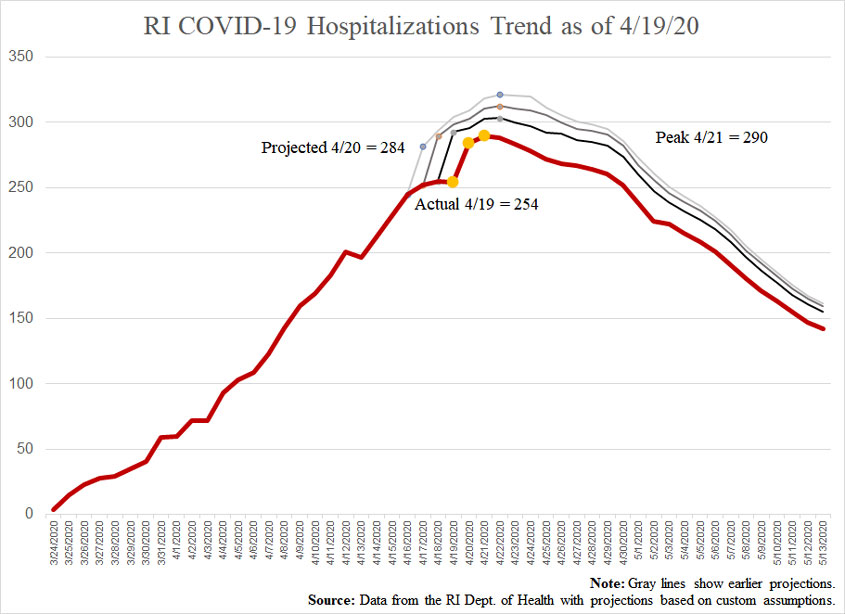
Hopefully the slight downturn in COVID-19 hospitalizations in Rhode Island reported today will mark this as the start of the down slope in infections. The model I’ve been following suggests we’ll have a couple more days of increases, but that trend is affected by the fact that I’m still capturing a few days of large increases in my averages.
As it was, for today, I’d projected 293 hospitalizations, but the reported number was actually down one, to 254. The following chart reflects the updated projections.
Broadening to the three key metrics we’re all watching, this is how we’re looking:
It is more than disappointing to see the numbers of deaths coming in higher than projected even as other metrics slow down. That could just be the fact that the disease worked its way into some high-risk populations, so recovery will lag.
Another important point as the governor starts talking about what we’ll have to see before she’ll permit us to get back to something closer to regular life: If she bases her judgment on the number of actual cases, that’s the wrong measure. Total cases are going to keep going up for the foreseeable future (although current trends put them hitting a plateau in mid-May if we don’t loosen restrictions.
This is why it is important for people in power to start talking about active cases. When it comes to the spread of the disease, somebody who has had the disease and recovered will almost certainly be a walking stopper of the disease. It is amazing that nobody in Rhode Island is talking about how many have recovered.
My model has active cases peaking at 3,902 on Tuesday, with an underlying 1,065 people having recovered. The question the governor should be encouraging us to consider and discuss among ourselves (this being a government of, by, and for the people, you know) is what should be tolerable.
If we focus our energies on protecting at-risk people, then we can start to open up for everybody else and loosen or tighten our behavior to stay within an acceptable margin for hospitalizations. For example, if COVID-19 hospitalizations fall between 150-200 people at any given time, with only a few deaths attributable to the disease each day, is that too many, or should the acceptable threshold be higher?
Keep in mind that our current solution is creating a breeding ground for social diseases and deaths associated with those.
I noticed something interesting today. Thus far, Governor Raimondo’s daily briefings on the coronavirus have produced a flurry of social media posts and articles emphasizing three metrics: cases, hospitalizations, and deaths. Over recent weeks, some journalists have said that hospitalizations is the key trend to watch, and when the governor gave a little bit of transparency into the data behind her decision-making, she released a chart projecting… yes… hospitalizations.
Well, while it may only be a temporary reprieve, the increase in hospitalizations has slowed way down in the past couple days, and suddenly that is no longer the subject of concern. Some local reporters have even switched to emphasizing only cases and deaths.
But that’s not how informing the public about trends is supposed to go. We shouldn’t follow a metric until it stops being interesting and then switch to something more topical.
So, to keep up the series of posts projecting hospitalizations in Rhode Island, here’s the chart based on today’s new data. Yesterday’s projection was for us to have 289 people in the hospital today, and the reported number was actually 255. It would be reasonable to suggest that the projection for tomorrow, of 293, is once again too high, but this model measures trends over the past week so as to be less volatile.
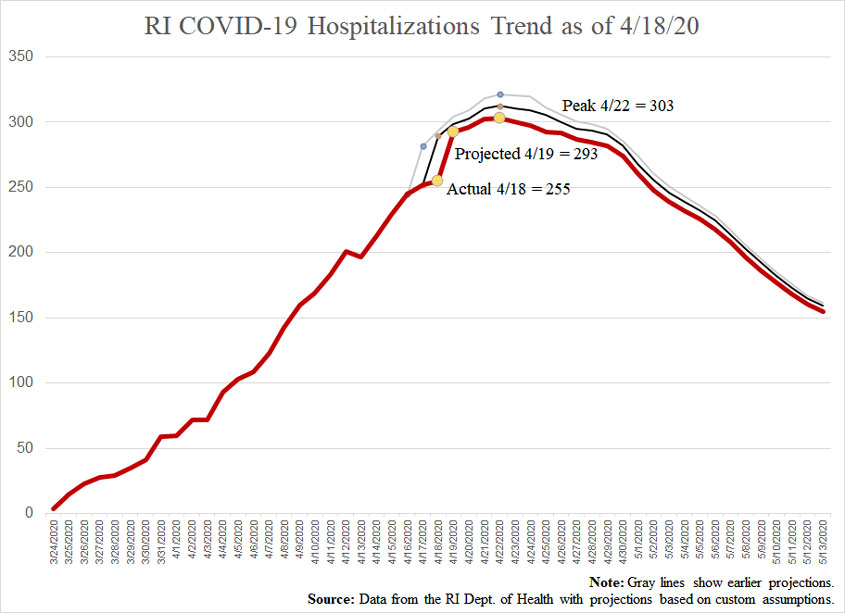
Based on the new numbers, the model suggests that tomorrow’s report will be:
Unfortunately, although hospitalizations have been coming in below estimates, cases and deaths have been a little higher than projected.
Turning back to hospitalizations, the three models currently suggest they’ll peak as follows:
It occurs to me that daily comparisons of COVID-19 predictions versus reported numbers would be more useful if the model is adjusted soon after the daily data dump, so I’ll put up two of these posts today. This one adjusts my model for yesterday’s numbers, and this afternoon, I’ll put up another based on whatever news the governor reports.
For April 17, I had predicted 282 total hospitalizations (as in, people currently in the hospital). The reported number was 252. Adjusting for the reported numbers of cases and hospitalizations produces the following:
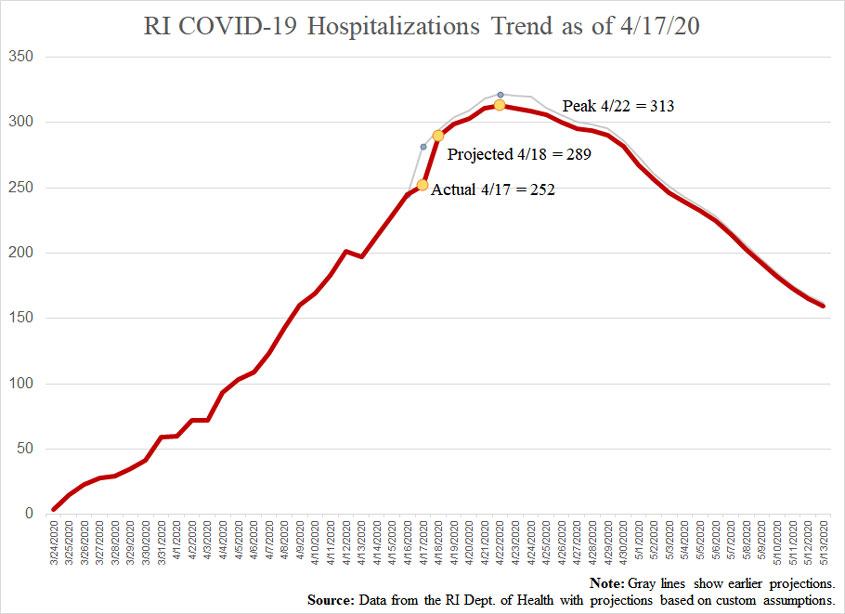
For the record, the underlying predictions that produce this line suggest that today the governor will announce:
As of this writing, the three models I’m tracking suggest the following change in hospitalizations:
The various models projecting RI hospitalizations based on COVID-19 create the opportunity for data hobbyists to try their hands at predictive modeling. Here’s mine.
Governor Raimondo announced that she was going to give Rhode Islanders more transparency into the data that she’s using to make decisions about the extent of our freedom during the COVID-19 wave, and even the RI Center for Freedom & Prosperity commended the intention. What Rhode Islanders actually got, however, wasn’t much transparency, but rather, an incomplete chart of a single metric without any description of the methodology.
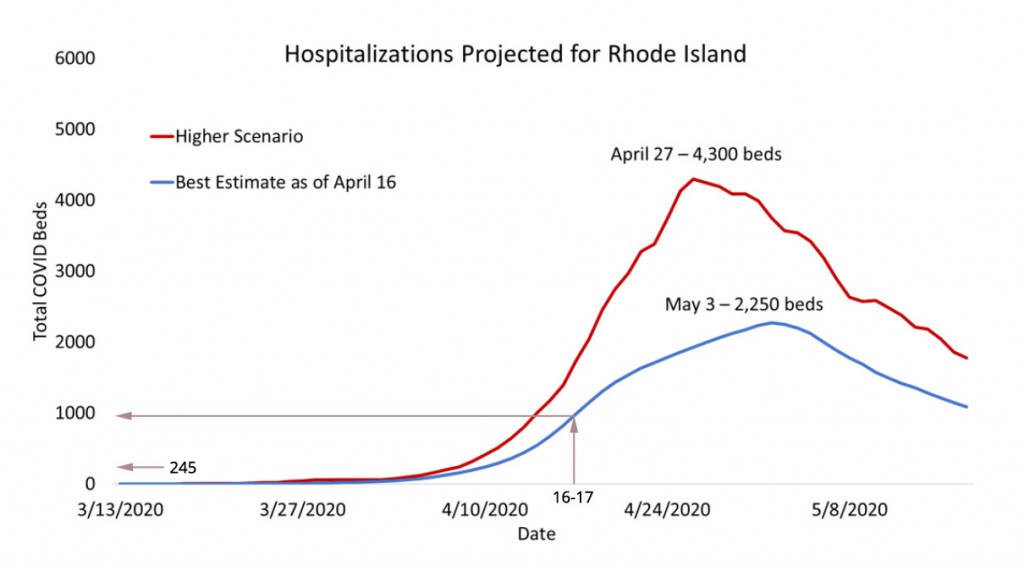
What’s conspicuously missing from this chart is a “lower scenario.” See, for example, the IHME model for Rhode Island, which has a worst-case scenario of 4,386 hospital beds needed on May 6, a “projection” of 942 on May 2, and a best-case scenario that has us already beginning to see a reduction.
Rhode Islanders shouldn’t hope for that outcome, but given how high the IHME’s projections have proven so far versus reality and how much higher the governor’s estimates apparently are than theirs, we should expect many fewer hospitalizations than she’s saying. It’s difficult not to conclude that she’s painting a bleak picture so as to mislead Rhode Islanders into better compliance with her directives. That’s especially true if you notice that the governor’s “best estimate” line appears to show nearly 1,000 people in the hospital today, when the actual number is 245.
As I’ve been saying, we are adults and deserve accurate information. We are not children who need an elected mother to coax us with phrases like, “I need you to be brave.”
Again, rates of growth have been slowing. Seventeen days ago, hospitalizations were increasing around 25% every day. That’s down to about 7% now. At the same time, the increase of total cases has been slowing, as has the percentage of all cases who are going to the hospital.
The question the governor apparently didn’t answer (and that apparently nobody asked) is why we should expect these trends to reverse such that the number of hospitalizations will be nine times higher in 17 days than it is right now. That would be an average of 15% increase every day. Why should we expect the rate of hospitalization to accelerate like that?
Maybe there’s some data out there that would give us reason to expect such an outcome, but we should know what it is, and the people who gave Raimondo her chart should be able to explain it to her.
Looked at more closely, the Imperial College epidemiological model whose frightening projections set our current reaction in motion
Rhode Island’s hospitals and healthcare systems are disproportionally represented on Fitch’s downgrade list and so disproportionately endangered by the onerous and dangerously archaic COVID-19 lockdown.
In George Orwell’s dystopian novel, 1984, the unironic slogans of the totalitarian government are: “war is peace,” “freedom is slavery,” and “ignorance is strength.” The modern totalitarians of the progressive American Left who have ramped up their efforts in the past decade have added “discrimination is tolerance.”
Witness this statement from the American Geophysical Union (AGU) explaining why the organization, along with the Geological Society of America (GSA), banned Brigham Young University (BYU) from advertising jobs for which their members might be qualified:
“AGU has always encouraged and fostered a diverse geoscience community throughout its history because we believe—and repeatedly see—that diversity and inclusion are essential to advancing science,” Billy Williams, the union’s vice president of ethics, diversity, and inclusion, wrote in a statement. “Since the job posting from BYU referenced its Honor Code as a requirement of employment, which conflicts with our policy, we removed the job posting from our website.”
This isn’t just a faint echo of Orwell’s constructs; it’s the actual thing. To restate, the VP of “ethics, diversity, and inclusion” is saying that his organization must shun a well-regarded university because “diversity and inclusion are essential to advancing science.” That is, they must discriminate against adherents of a religion because the Honor Code that it inspires conflicts with the progressive fundamentalism of the geological organizations.
Science, according to this way of thinking, is advanced by restricting participation based on ideological rules that have nothing to do with the narrow field of study or practice of investigation. In the view of these organizations, no geologist who belongs to either the union or the society and who has beliefs that would fit with those of BYU should be permitted to find a work environment in which they’d be comfortable. Indeed, the message is clearly sent that they should keep their beliefs to themselves if they know what is good for them.
That a statement like the one quoted above could be passed off with a straight face and without bringing upon its author a wave of ridicule is terrifying.
Here’s an appropriate lunchtime story, by Sharon Begley in Scientific American:
[Christopher] Ramsden, of the National Institutes of Health, unearthed raw data from a 40-year-old study, which challenges the dogma that eating vegetable fats instead of animal fats is good for the heart. The study, the largest gold-standard experiment testing that idea, found the opposite, Ramsden and his colleagues reported on Tuesday in BMJ (formerly the British Medical Journal).
Although the study is more than just another entry in the long-running nutrition wars—it is more rigorous than the vast majority of research on the topic—Ramsden makes no claims that it settles the question. Instead, he said, his discovery and analysis of long-lost data underline how the failure to publish the results of clinical trials can undermine truth.
If anything, the findings of this study are the opposite of the common assumption. Changing the fats that people eat does lower cholesterol…
But that lowered cholesterol did not help people live longer. Instead, the lower cholesterol fell, the higher the risk of dying: 22 percent higher for every 30-point fall. Nor did the corn-oil group have less atherosclerosis or fewer heart attacks.
Asked why the study was never published, the original researcher’s son seems to suggest his father wanted to find a link between fats and heart disease, and so might have assumed his study just wasn’t sufficient.
A properly skeptical diet continues to seem most appropriate: Eat a variety of foods, including those that you enjoy, but don’t overdo anything. Ever notice, by the way, that the same ideological movement that elevates evolution to a religion also insists that everything evolution has led us to want to eat must be bad for us?
Today, children around the world are participating in a Global Climate Strike. I won’t criticize them for this highly misguided activity but rather the adults – including, notably and disturbingly, educators – who have foisted on them a hysteria that is almost entirely free of facts and reasoning. For example, one important data point these children are almost certainly not learning in school or anywhere: the actual extent of the greenhouse gases generated by humans and, thereby, what we can conclude about our (very limited) culpability in global warming.
It is less than 6%. ALL of man’s fossil fueled activity – all factories, all power plants, all manufacturing, all cars, all countries, all 7.5 billion people – contributes less than 6% of greenhouse gases generated on the planet. The balance is generated naturally by Earth itself.
A run-down of items in Rhode Island political news for the week.