Games with Models, 5/16/20 Data
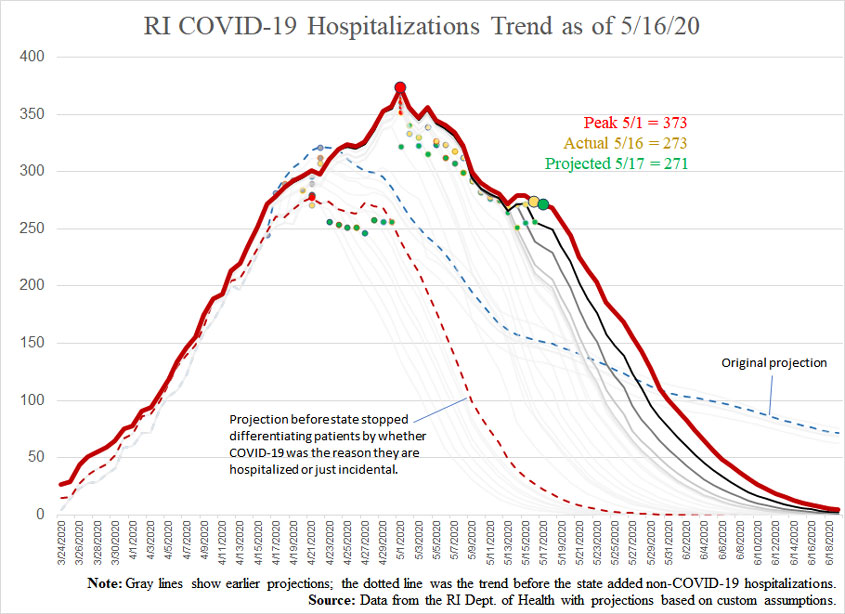
As today’s chart shows, what looked to be a couple of days of increased hospitalizations has been revised as one day, then leveling out, and turning back downward. The number of COVID-19 deaths in Rhode Island has also been revised going back a number of days. and generally continuing at the same pace. Also continuing is the trend that more deaths are occurring outside of hospitals (i.e., probably in nursing homes) than inside them — 60% more over the past two weeks.
While the number of new cases overall increased more than my projection, the number of new tests has continued to be significantly higher than it had been, so one might expect more cases to be found.
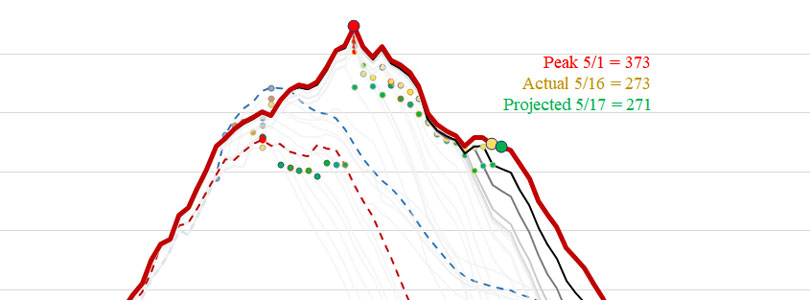
In the following chart, note in particular that the number of people in the hospital who have tested positive for COVID-19 has fallen by 100 patients in a couple of weeks, from 373 for the number reported on May 1 to 273 reported today.
(See here for my original methodology and here for a subsequent modification I made.)
Projections versus actuals (date of report):
- Cases:
- Projection for 5/16: 12,341
- Actual for 5/16: 12,434
- Projection for 5/27: 12,560
- Hospitalizations:
- Projection for 5/16: 256
- Actual for 5/16: 273
- Projection for 5/17: 271
- Deaths:
- Projection for 5/16: 481
- Actual for 5/16: 489
- Projection for 5/17: 494

