Age Differences in Effects and Treatments and Games with Models, 5/28/20
At her daily COVID-19 press conference today, Governor Gina Raimondo noted that “the vast majority of our deaths are concentrated in nursing homes.” Notably, the latest date for which hospitalization info is available (5/25) shows zero deaths in the hospital, with seven non-hospital deaths. Some of those may not have been in nursing homes, but it is likely the majority were.
That’s been the case for a while. Throughout this entire saga, there has been only one day on which deaths in the hospital numbered in the double digits in Rhode Island (11 on April 29). Meanwhile, deaths outside of the hospital have been stubbornly double-digit until around the past week.
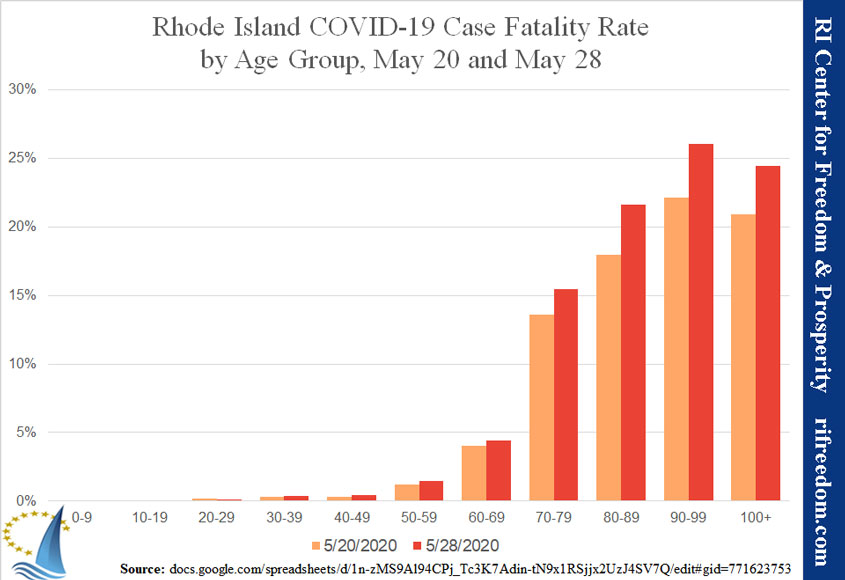
The governor says deaths in nursing homes are “really hard to control.” Well, maybe that’s where we should have put our focus and our resources, rather than causing untold harm through a society-wide panic and economic shutdown. Two charts illustrate these points well.
The first shows the case fatality rates by age group. This is the percentage of known COVID-19 infected Rhode Islanders who have died. The lighter columns use data from May 20 and the darker columns use May 28 data. Note that the fatality rates remain low or non-existent for those below 60 years of age, and certainly below 50. Note also that the death rates were significantly higher this week, which (hopefully) reflects only that the death curve lags the curve for the number of cases, and increases of the latter has been slowing down.
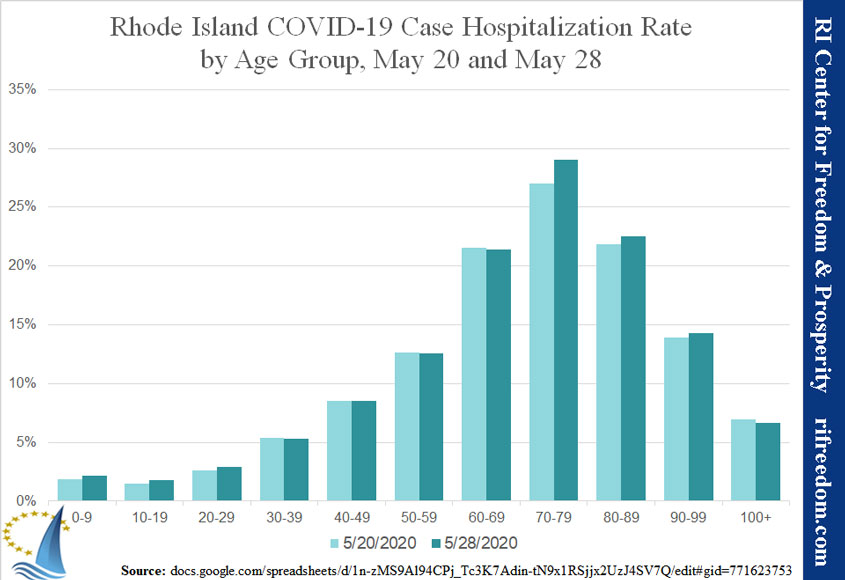
The second chart shows the same sort of information for hospitalizations, specifically the number of cases who have ever been hospitalized for the disease. Note that older Rhode Islanders, though more likely to die, are less likely to be hospitalized. Note also that the hospitalization rates haven’t gone up much, if at all, indicating that the notion of the lagging death curve is accurate.
So, again, the approach our government chose to dealing with COVID-19 inflicted consequences on people at very little risk of death and allocated resources to places (hospitals) that are clearly not well matched to the people at most risk.
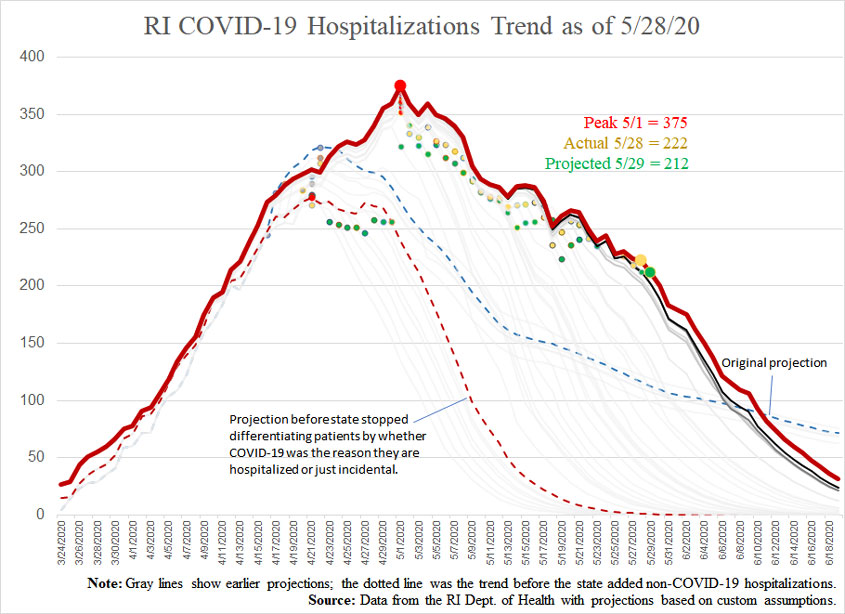
Here (by the way) is my updated projection chart for hospitalizations, which included another significant revision to the prior data on which the projections for today were based.
(See here for my original methodology and here for a subsequent modification I made.)
Projections versus actuals (date of report).
- Cases:
- Projection for 5/28: 14,449
- Actual for 5/28: 14,494
- Projection for 5/29: 14,586
- Hospitalizations:
- Projection for 5/28: 212
- Actual for 5/28: 222
- Projection for 5/29: 212
- Deaths:
- Projection for 5/28: 659
- Actual for 5/28: 677
- Projection for 5/29: 681