Games with Models, 6/1/20 Data
We’re seeing continuing good news on the COVID-19 front in RI. Despite overall consistency in the number of tests in the past few days (arguably, even, a slight increase), the number that came back positive was under 100 for two days in a row.
The number of people in the hospital who tested positive for COVID-19 dipped below 200 for the first time since early April. However, hospitalization data lags the rest by two days, so that was the number before the two days of only-double-digit positive tests.
The number of reported deaths for the past two days was also low: three and one. This number comes with the caveat that deaths have tended to be revised upwards over the following days and weeks, but nonetheless, over the past 10 days, only three were double digits, as currently reported.
In keeping with the purpose of this whole “games with models” series, two developments would make for interesting experiments if anybody can think of ways to test them. One will be whether we see a surge in cases following the large protests of this weekend and, more interestingly, where we see them.
The other might actually be harder. All the data has suggested that this disease is largely a problem for the elderly and people with underlying health conditions, but relatively mild for everybody else. Those of us who’ve suggested that this is evidence the shutdown was overkill (or, at least, that months of it were overkill) should think of how to address a reasonable counterpoint. Namely, people in “congregate care” facilities are characterized not only by their vulnerability, but also by the difficulty of keeping them socially distant.
So, could it be that some portion of the disparate outcome that skewed the death toll so much toward the elderly had more to do with the failure to protect them than the nature of the virus? In the general population, one would expect people who were at risk to be more likely to be extra vigilant about self-isolation, so the cases would be more common among those at least risk.
As we move toward reopening, especially if we get to flu season without having found the miracle cure for COVID-19, we would do well to have as clear a picture as possible about the actual risk profiles of the disease. So where could one look for comparisons? Perhaps the case fatality rates in prisons or youth congregate care. If they’re getting sick at the rates of people in nursing homes, yet their fatalities closely match the non-nursing-home population, that would help put these questions to rest and give us even more confidence getting back to normal life.
(See here for my original methodology and here for a subsequent modification I made.)
Projections versus actuals (date of report).
- Cases:
- Projection for 6/1: None made
- Actual for 6/1: 14,991
- Projection for 6/2: 15,072
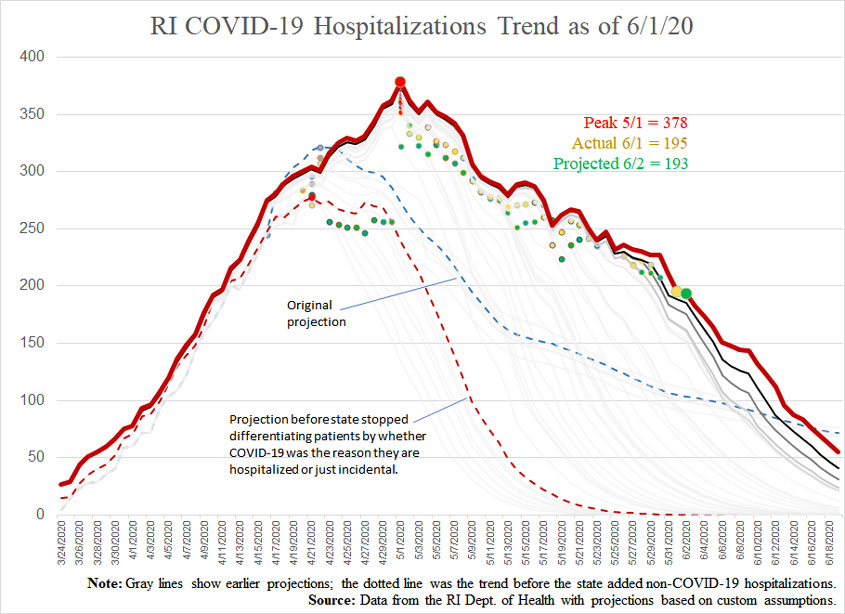
- Hospitalization:
- Projection for 6/1: None made
- Actual for 6/1: 195
- Projection for 6/2: 193
- Deaths:
- Projection for 6/1: None made
- Actual for 6/1: 720
- Projection for 6/2: 724