
Games with Models, 6/19/20 Data
The trends continue:
- New positive tests below 100.
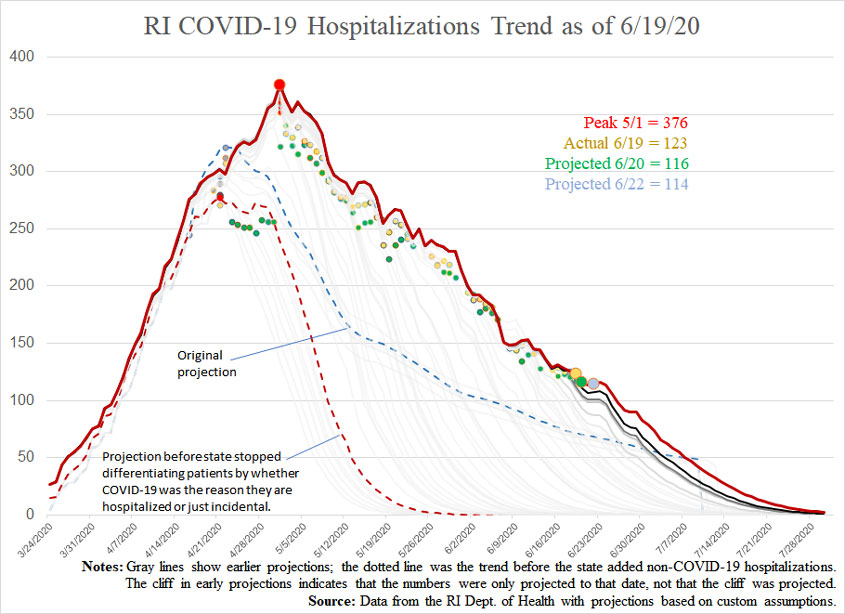
- Hospitalizations’ trending down and probably kept artificially high by the inclusion of patients who were admitted for other reasons.
- Steady, low intensive care.
- Single-digit daily deaths.
On that last point, the data (subject to revision) currently shows two full weeks of single-digit deaths, with 13 of those 14 days seeing no more than two deaths in the hospital.
Additionally, it has now been two weeks since the large rally in Providence, including the governor’s naked-faced prayer session in the midst of the crowd. If we were going to see a spike from that large gathering, we’d have seen it by now, and if that activity didn’t result in a spike, we shouldn’t be hobbling our lives in so many other ways.
In the daily chart, I’ve added a projection for Monday because I haven’t been updating during the weekend. So, out of curiosity, we’re see how the model fares over a three-day span.
(See here for my original methodology and here for a subsequent modification I made.)
Projections versus actuals (date of report).
- Cases:
- Projection for 6/19: 16,312
- Actual for 6/19: 16,337
- Projection for 6/20: 16,378
- Projection for 6/22: 16,450
- Hospitalizations:
- Projection for 6/19: 118
- Actual for 6/19: 123
- Projection for 6/20: 116
- Projection for 6/22: 114
- Deaths:
- Projections for 6/19: 887
- Actual for 6/19: 894
- Projection for 6/20: 896
- Projection for 6/22: 900

