Games with Models, 8/3/20 Data
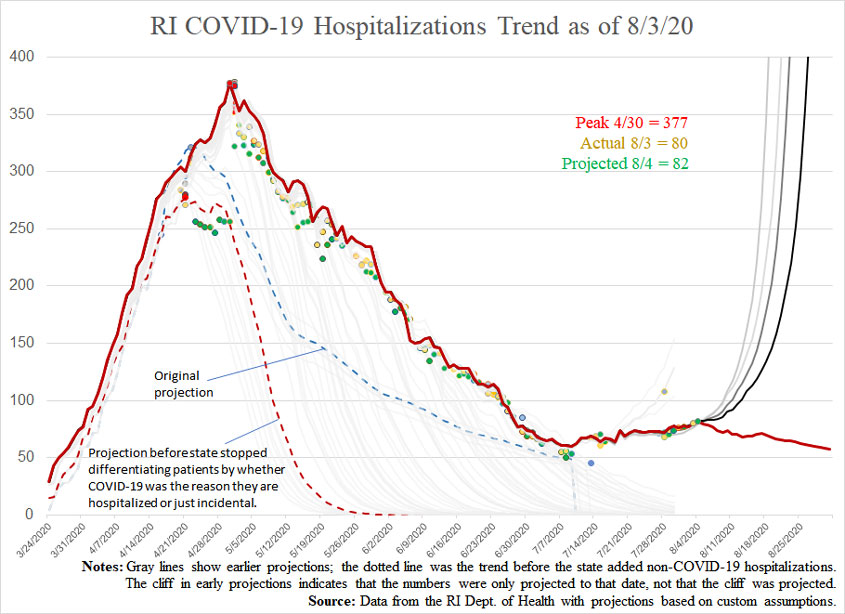
The notable thing about today’s report on COVID-19, at least when it comes to the model I’ve been playing with during the pandemic, is that the math has flipped the projection from exponential increase back to gradual decline. Just like that.
Remember that I’m not making any assumptions about decisions, actions, mutations, or anything, here. The line is purely a function of the trends that we’ve been seeing. So, the number of new cases found each day dipped a little, and the number of people in the hospital held pretty steady for a time, and the story changed. (Keep in mind, too, that the line is now tracking people in the hospital with COVID-19, even though they might be there for another reason. In the past week, I’ve heard two anecdotes of people going into the hospital for something else and apparently catching it there.)
As simplistic as my model is, it’s a good reminder about the skepticism we ought to bring to attempts to predict the future. When trends start going up, the curve can be scary, because we don’t know what will stop them, but that doesn’t mean we should respond as if they won’t stop. So, now, with the governor having held our state in her “phase 3” of reopening for the entire month of August, we’re stuck suffering because of her gut sense of what would happen.
Another angle of the reporting about COVID in RI that needs some context is the statement that we now have over 19,000 cases. This is misleading, because by now a majority of those people have recovered, which is an important number we’re not getting. If we assume that the average COVID-19 infection lasts two weeks, we’re now talking only 1,257 of the state’s millionish people. The number being reported as our number of cases, in other words, is probably about fifteen times higher than what people would tend to think when they hear “the number of cases.” Eventually, cases have to be closed.
Similarly, the growing death and steady hospitalization numbers are creating a skewed picture. For one thing, they’re revised backwards for weeks or even months, so “new deaths” doesn’t mean “new yesterday.” When it comes to hospitalizations, an apparent increase is often the result of a decrease in the number of people let out of the hospital, not an increase in the number of people going in, which could be happening because people are there for some other reason.
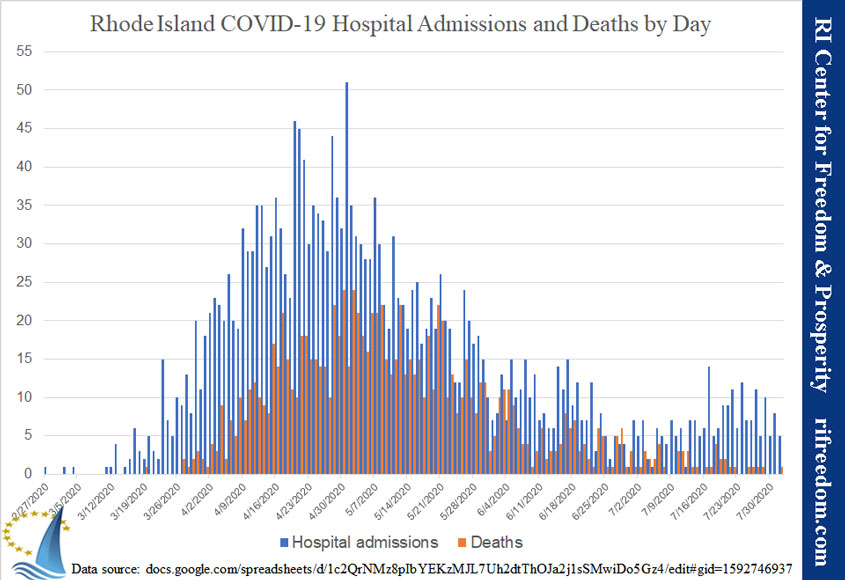
The following chart shows the number of people admitted to the hospital with (not for) COVID-19 since late February, as well as the number of people who have died with it each day. Opinions may differ, but these trends do not seem to justify hurting our children and our economy in a panic. Basically, the numbers have been stable, which is a state of affairs in which we should move forward, not put on the brakes in fear.
(See here for my original methodology and here for a subsequent modification I made. A thorough explanation of the chart is included in this post.)
Projections versus actuals (date of report).
- Cases:
- Projection for 8/3 (made 7/31): 19,407
- Actual for 8/3: 19,246
- Projection for 8/4: 19,357
- Hospitalizations:
- Projection for 8/3 (made 7/31): 80
- Actual for 8/3: 80
- Projection for 8/4: 82
- Deaths:
- Projection for 8/3 (made 7/31): 1,027
- Actual for 8/3: 1,010
- Projection for 8/4: 1,016

