Where Are the Providence Children Coming From?
Via the RI Taxpayers daily newsletter, I see that Providence is defying the statewide trend of fewer students’ enrolling in public school. Here’s Anni Shalvey, from WPRI:
In 2011, the Providence School District closed five schools in response to dwindling enrollment. Since then, an unexpected bump in students is bringing the classrooms to capacity.
“We’re looking at a shortage of seats in middle schools that was unanticipated,” said Christina O’Reilly of the Providence School District.
It’s not a huge bump – about a 1.7-percent increase in enrollment since the schools were closed, according to data from the Rhode Island Department of Education.
But this increase is contrary to the overall downward trend happening in Rhode Island – making Providence stand out.
So who’s coming and going in Providence schools? According to October enrollment data, starting with the 2010-2011 school year, the cumulative increases (meaning each school year’s increase from 2010-11) by racial category was as shown in the following chart.
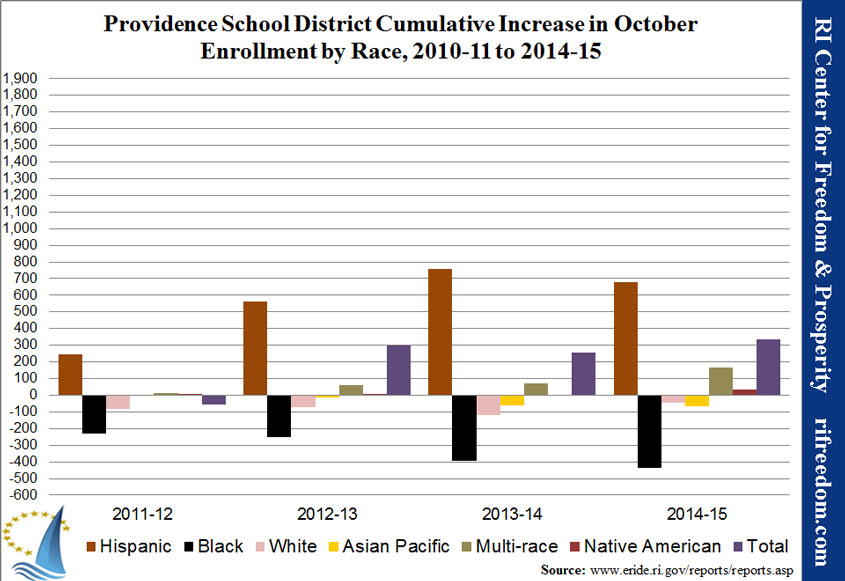
Providence schools have actually seen a decrease in students identifying as black, white, and Asian. In just four years, the black population of Providence schools fell almost 10%. That means the small bump in total enrollment was the result of an even larger increase in mixed-race, native American, and especially Hispanic students.
The next chart looks at the data by categories of services that the students receive. The acronyms stand for:
- IEP = individualized education plan (i.e., some sort of specialized education or behavioral services)
- FRL = free or reduced-price lunch eligibility
- LEP = limited English proficiency

The biggest story, with this chart, is the increase in students requiring some accommodations for a lack of proficiency with English. Such students increased from 14.3% of the student population to 21.8%.
Summed up, then, the small increase in Providence enrollment resulted from a rather large increase in Hispanic students who need help with English. That is, the student body is likely to be transitioning toward immigrants from Central and South America.
It’s a little surprising, therefore, that the FRL numbers went down, because they are an indication of income, and one would expect urban immigrants to skew toward lower-income groups. However, more than 80% of students are eligible for the program, which means we’re mainly talking displacement. There are also gradations of the program; poorer students get free lunch, while families with a little bit more income qualify only for reduced-price lunches, and this data doesn’t show whether there’s been a shift between those groups.
