Adversity and SATs Makes for an Interesting Scatterplot
The plans of the College Board to begin assigning SAT takers “adversity scores” so college admissions boards could take “diversity” into account in a seemingly more-objective way met with public outcry.
For one thing, there’s something unseemly about the implicit statement that a high score is not an achievement in the absence of adversity. For another thing, adversity is so broad and individualized as to not be appropriate. That is, a student who is advantaged by the College Board’s definition may be overcoming severe adversity in something else that the College Board knows nothing about.
Put these two considerations together, and you can see the injustice of telling a white student from Barrington High School that his 1240 SAT score is worth less than the 928 score of a student at Central High in Providence. A teenager from Barrington can have a challenging home life, physical difficulties, psychological hurdles, and so on, while a teenager from Providence can have huge advantages that don’t register on a demographic survey. We do grievous harm to our society if we start encouraging either to promote their disadvantages as a surreptitious way to maximize their advantages.
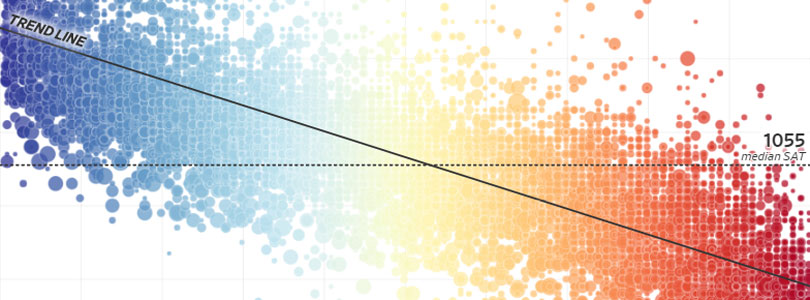
All that said, the Wall Street Journal has a neat interactive tool plotting schools’ median SAT scores on the y-axis and their adversity scores on the x-axis. Applied to whole schools, and utilized by people with additional information about the communities, this could actually be a useful device for families as consumers of their children’s schools.
So, for example, my town of Tiverton is just shy of the national median SAT score, at 1030, and comes in right at the middle, with a 51 adversity score. Westport, just over the Massachusetts line, does slightly better than median on the SAT, with 1060, despite being slightly more “adverse,” so to speak, at 55. More dramatically, Barrington High School’s 1240 median SAT is almost exactly the average for schools that share its low adversity score of 1. This compares with Providence Central High’s 800 SAT, which is much worse than the average for schools that share its 97 diversity.
The tool allows a leap to private schools, too. Near Tiverton and Westport is a relatively low-cost Catholic high school, Bishop Stang. There, an 1170 median SAT matches up to an adversity score of 61. Such schools, in other words, offer both more diversity and relatively high scores. La Salle Academy in Providence, by contrast, also has significantly better SAT results than nearby public schools, at 1120, but on adversity, it scores 39. This looks more like an option for families interested in escaping some of the adversity of their city if they can afford it.
Readers should bring more skepticism to another feature of the interactive tool, although it is still intriguing from the perspective of a consumer. The Wall Street Journal worked with Georgetown professor Jeff Strohl to weight the SAT scores to show how far schools are from the median among their adversity peers. In other words, if we equalize things such that the median SAT score at 1-adversity schools counted the same as a the median SAT score at 99-adversity schools, how much does a particular school add to or fall short of the mark?
By this measure, Barrington is dramatically under-serving its students. As mentioned above, its median SAT is exactly in the middle for schools similarly lacking adversity, but according to Strohl, that is entirely a function of its demographics. With average adversity, the school’s SAT would be a substandard 1029.
When its SAT score is weighted, Central High School in Providence improves significantly, from 800 to 928, but this is only about half of the distance to the median. In other words, not only do students at Central suffer from their adversity, but their school system is failing them above and beyond that challenge.
Again, to stress the point, these generalizations make too many assumptions and sweep aside all of the individualism that comes with educating teenagers. Still, that sort of objection applies most sharply when the intended use of the tool is either the redistribution of wealth through government or the discounting of unfashionable applicants by an institution of higher education. If we start to think of families as active consumers in an environment of educational freedom (as we should), many of these objections evaporate, and we just have another useful datapoint as we figure out where to send our children to be educated.