Games with Models, 5/12/20 Data
Rhode Island’s COVID-19 data continues its improving trend. To some extent, it’s better than it looks because some newly reported deaths were revisions to earlier days. New positive tests was the lowest it’s been since April 7, and the rate of infection continues to decrease.
If we assume that cases are, on average, no longer active 14 days after diagnosis, then the number of such cases in Rhode Island has fallen from 4,810 on May 2 to 3,688 yesterday, a 23% decline.
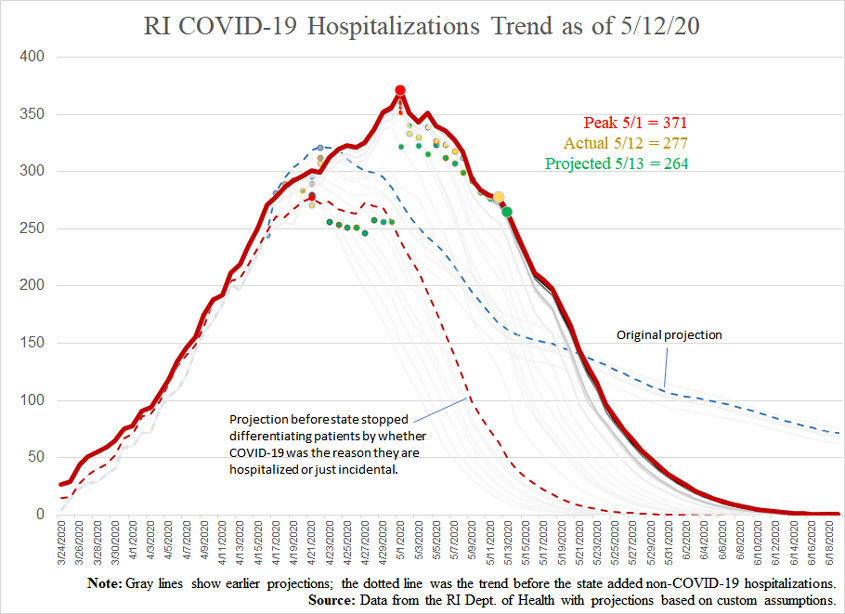
Hospitalizations continue to decline in keeping with my simple projection model. Just because the we were approaching the last day I’d been showing on the chart, I’ve continued it out until the projection is for zero hospitalized patients. To be clear, I’m not actually predicting that; it’s just what the formula shows. It’s possible the formula would breakdown as the number gets smaller, but we also don’t know how loosening up restrictions on movement will affect things.
I’ve also made my original projection line more prominent… just for fun.
Projections versus actuals (date of reporting):
- Cases:
- Projection for 5/12: 11,602
- Actual for 5/12: 11,614
- Projection for 5/13: 11,755
- Hospitalizations:
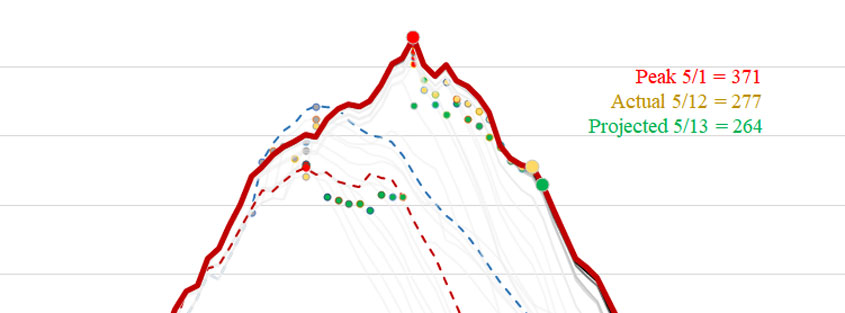
- Projection for 5/12: 275
- Actual for 5/12: 277
- Projection for 5/13: 264
- Deaths:
- Projection for 5/12: 436
- Actual for 5/12: 444
- Projection for 5/13: 449