Games with Models, 6/11/20 Data
Nationally, the narrative seems to be leaning toward a post-rally/riot return to fear of COVID-19. (I, for one, can’t wait to see what’s next!) But in Rhode Island, the daily update is pretty humdrum.
After four days of double-digit new cases, yesterday just barely tipped three digits, with 102. However, our 14-day infection rate continued to go down and is still less than 10%. Intensive care and ventilators are still about the same, edging down.
The local news media is still getting to report double-digit newly reported deaths, but that continues to result from revisions. Today, the revisions go back to early April. At this moment, the numbers show fewer than five for each of the past five days.
As for hospitalizations, new admissions edged up to 12, but discharges increased by more, to 12. All in all, this is how real-life trends tend to happen: They go up and down with a particular direction revealed over time. At this time, we’re still improving.

(See here for my original methodology and here for a subsequent modification I made.)
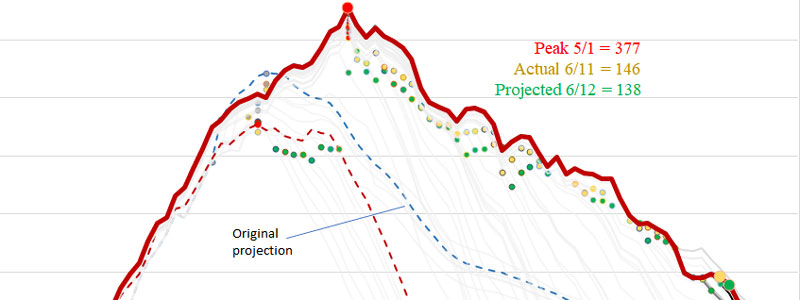
Projections versus actuals (date of report).
- Cases:
- Projection for 6/11: 15,810
- Actual for 6/11: 15,862
- Projection for 6/12: 15,918
- Hospitalizations:
- Projection for 6/11: 140
- Actual for 6/11: 146
- Projection for 6/12: 138
- Deaths:
- Projections for 6/11: 815
- Actual for 6/11: 823
- Projection for 6/12: 826