Games with Models, 6/9/20 Data
An interesting observation from today’s COVID-19 data release from the RI Department of Health is that the number of positive cases was actually revised down. At this point, assuming a 14-day average illness, every 10 people with COVID-19 are infecting only one additional person. When the disease was ramping up, we heard a lot about “exponential” increases in cases, which we never actually experienced, but we are now arguably seeing exponential decreases.
The summary of the data is that everything is improving, despite some opening up and despite riots and rallies. Given the data and recent events, there really is no excuse for keeping the brakes on people’s summer activities. Advise us to use caution, give us some pointers, and set us free. The idea that the governor is still wielding “emergency” powers is an affront to our civil rights.
Regarding my daily hospitalization projection chart, it’s actually surprisingly onpoint (at least for this one day!), leaving us on track for continued improvement.
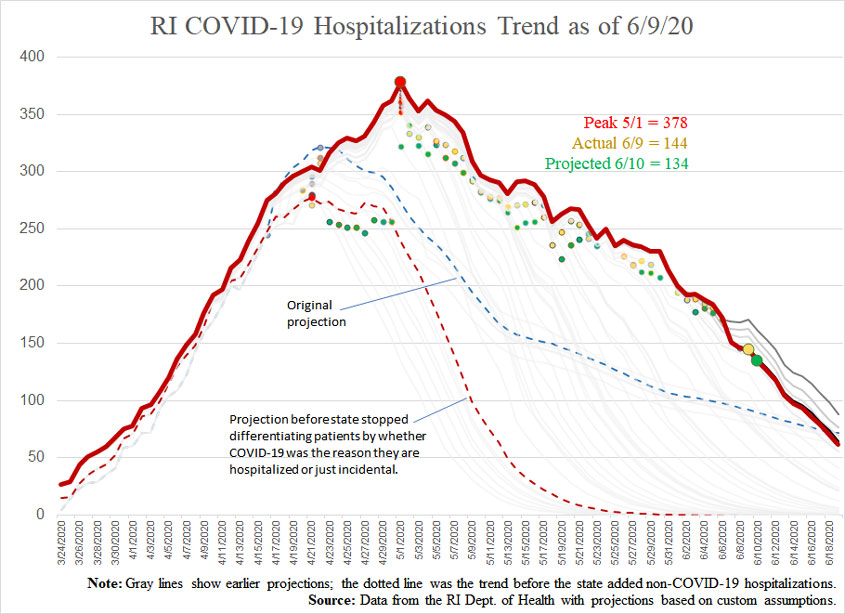
(See here for my original methodology and here for a subsequent modification I made.)
Projections versus actuals (date of report).
- Cases:
- Projection for 6/9: 15,705
- Actual for 6/9: 15,691
- Projection for 6/10: 15,749
- Hospitalizations:
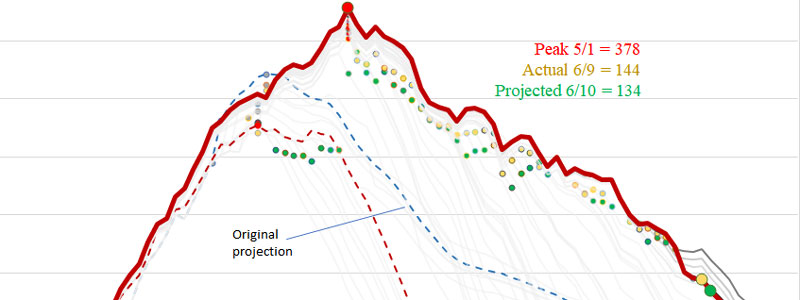
- Projection for 6/9: 146
- Actual for 6/9: 144
- Projection for 6/10: 134
- Deaths:
- Projections for 6/9: 802
- Actual for 6/9: 808
- Projection for 6/10: 811

