Games with Models, April 23 Data
With this edition, the two methodologies I started using yesterday begin to point to a narrative that could join my projections with the more pessimistic ones from the experts. (See here for the original methodology and here for the modification.)
The interesting puzzle with the data, at this point, is why the increase in the number of positive COVID-19 cases in Rhode Island has not slowed down as much as the trends have led me to project. It is starting to appear as if the current level of restriction simply produces a 6-7% daily increase in cases.
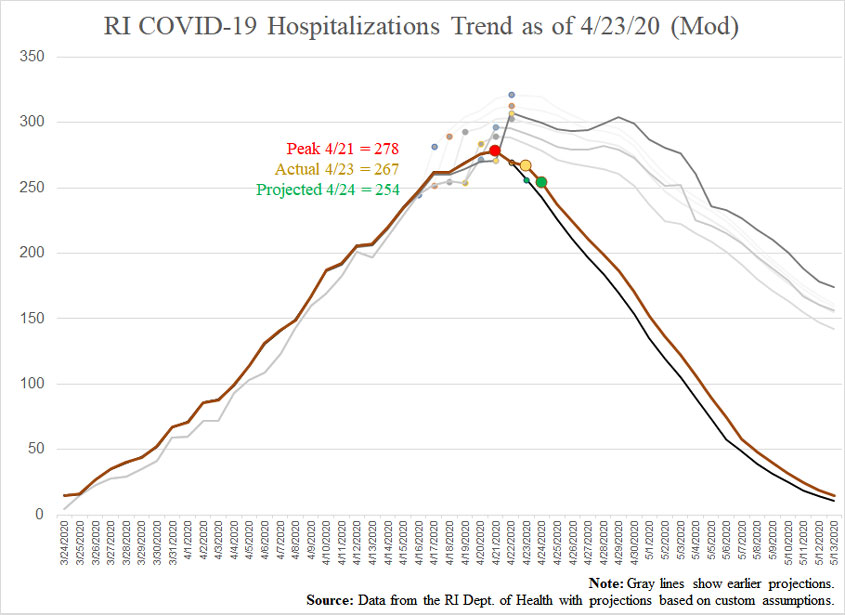
If the total number of new cases continued to drop, we’ll see the hospitalization rate shown in my modified chart. In fact, if I’d gotten the number of new cases right, my hospitalization projection would have been off by a single person.
However, if 6-7% daily increases are simply the norm, then we get something more like my original methodology… at least for the next two weeks, at which point the question is, “what then?” Without further restrictions, something else would have to happen to move the numbers down — be it the increasing number of immune residents, the effects of warmer weather suppressing the virus, or new treatments that protect against or minimize the illness.
In this case, one can understand why the governor is reluctant to ease restrictions. If we’ve found the actual infection rate of our lock-down (6-7% increase per day), and if it isn’t low enough to get the number of hospitalizations pointed toward zero, then opening things up will turn the curve in the other direction.
As to the “what then,” we simply can’t know. We don’t know how many people have already been infected with no symptoms. We don’t know how long their immunity might last. We don’t know if the virus will mutate for the worst. We don’t know.
All this indicates that the governor just does not have the power to completely solve this problem. We the People have not granted her the authority to do what would have to be done. We do not elect officials to defeat death.
This is why leaders should be encouraging us to think about what our thresholds are. Is our tolerance for hospitalizations the number of available beds we have, or is it lower? How many deaths per day are tolerable? And how do we start to measure the harms of economic restrictions? (If we refuse to accept 10 COVID-19 deaths per day, but the restrictions imposed lead to 11 suicides, overdoses, or other deaths per day, then our prevention is an illusion.)
In my view, the governor’s legitimate role is to ensure that the virus does not overwhelm our healthcare system. Theoretically, it could collapse our economy, but that’s what our response is doing. So, figure out what our capacity is, track the trends, and start opening things up.

- Cases:
- Projection for 4/23: 6,083
- Actual for 4/23: 6,256
- Projection for 4/24: 6,511
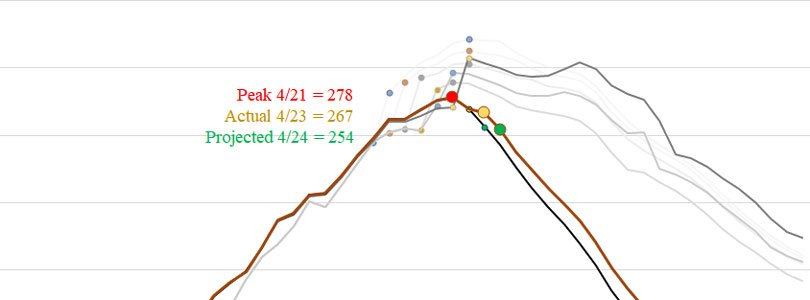
- Hospitalizations:
- Projections for 4/23: 306, 256 (mod)
- Actual for 4/23: 267
- Projections for 4/24: 303, 254 (mod)
- Deaths:
- Projection for 4/23: 189
- Actual for 4/23: 189
- Projection for 4/24: 197