K-12 Enrollment Versus Expenditures in RI and Woonsocket
With the legislative session having come to an end, education has moved toward the top of the list of headline topics. Woonsocket’s School Committee voted, yesterday, to request a state takeover of its district. Meanwhile, the General Assembly declined to grant permission for a massive supplemental tax bill in the city. More broadly, the legislature did opt to accelerate state aid payments to many of Rhode Island’s 36 districts.
Given a little context, though, the conversation might be substantially different.
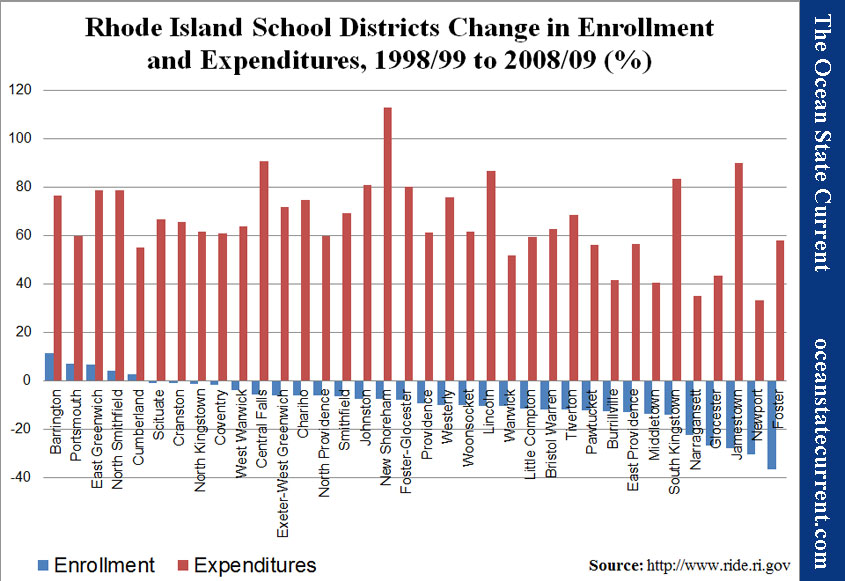
According to data provided on the Web site of the Rhode Island Department of Education (RIDE), enrollment is down dramatically across the state. RIDE’s data begins with the 1998-1999 school year and ends with 2011-2012, and over that period, only Barrington and East Greenwich saw overall increases. The average Rhode Island school district experienced a 12.6% drop in students.
That dramatic statewide slide in student population did not, however, accompany a parallel decrease in expenditures — or any decrease at all. Unfortunately, the state ceased posting total expenditure data after the 2008-2009 school year. But in the eleven years of data available, the average school district’s total expenditures increased 65.9%. By comparison, the inflation rate from June 1999 to June 2009 was less than half that, at 29.8%.
The following chart is sorted from largest increase in enrollment to largest decrease in enrollment, and the correlation with spending is mild, at best.
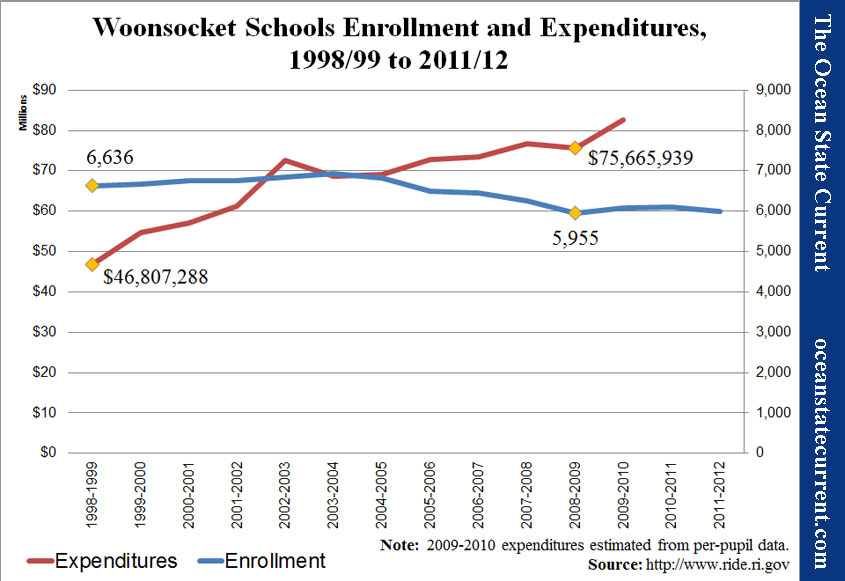
Focusing in on Woonsocket, district expenditures increased 61.7%, even as enrollment slipped 10.3%. In the years since, enrollment has remained steady, but spending appears to have continued its upward climb.
As the city considers its next steps (under the guidance of the state-appointed budget commission now ensconced in city hall), residents would do well to evaluate the present crisis in the light of past trends. The same is true for Rhode Islanders in every municipality.


