PARCC Results Prove Moral Imperative of Dramatic Change in Education
The Rhode Island Department of Education (RIDE) has released schools’ results for the first year of Partnership for Assessment of Readiness for College and Careers (PARCC) tests implemented under the federal Common Core initiative, and they are abysmal.
RIDE officials make a fair point, saying that this was the first run of a new test. However, they made the decision to switch away from the locally developed New England Common Assessment Program (NECAP). And unless schools have truly devolved to the point of entirely teaching students how to take specific tests, rather than developing the knowledge that the tests are supposed to measure, the results of a switch shouldn’t be this bad.
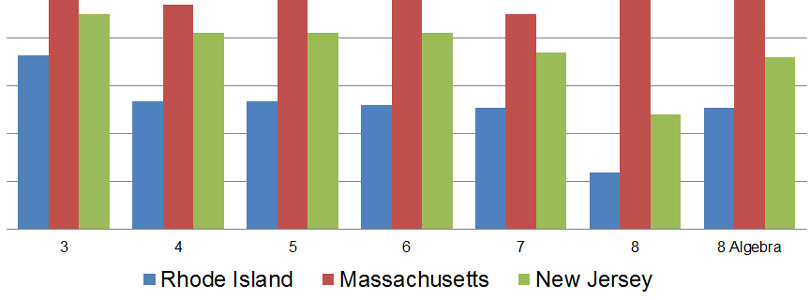
More importantly, comparison with other states — particularly our neighbor to the north — shows that Rhode Island simply underperforms. We know that from NAEP scores, and the PARCC results illustrate it again. The following charts don’t include high school because Massachusetts is still utilizing its local MCAS tests at that level.

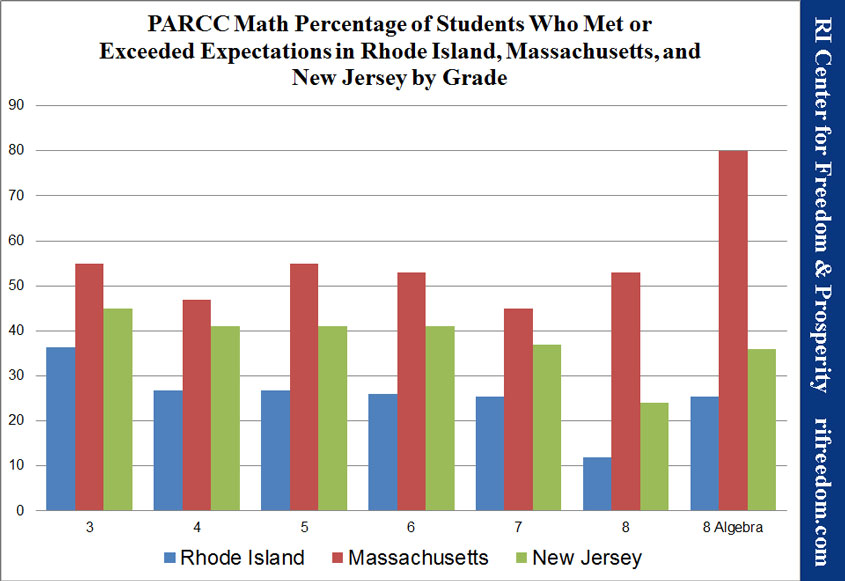
Overall, only 36% of Rhode Island students met or exceeded expectations in English language arts (ELA), and only 25% met or exceeded expectations in math. In ELA, the results were within a relatively small margin depending on grade level: at 38% for elementary schools, 36% for middle schools, and 32% for high schools. In math, however, the drop-off is steep (if results this low can be said to have any height): 30% in elementary slips to 26% in middle school, which drops by more than half, to 12% in high school.
Much of the commentary from inside and outside of state government will focus on disparities within Rhode Island’s education system, and those are there. In ELA, the met-or-exceeded percentages range from a high of 71% in Barrington to a low of 10% in Central falls, while math ranges from 58% in East Greenwich to 5% in Central Falls.
With regard to student subgroups, disparities also exist. Around 46% fewer blacks and Hispanics meet or exceed expectations in ELA than the state average, which drops further to 57% fewer in math. For low-income students, the percentages are 43% fewer in ELA and 52% fewer in math, while for boys they’re 18% fewer in ELA and 4% fewer in math.
Looking more closely at the grade-level results, however, supports the argument that the state as a whole isn’t doing well enough that its focus should be on narrowing gaps among students. Yes, an unacceptable 1% of Central Falls high school students met or exceeded expectations in math, versus 59% in East Greenwich, but the lines aren’t so clear. Coventry high school came in at 7% and Tiverton high hit 8%, while Westerly reached 10%. In other words, the suburban versus urban school narrative breaks down, at least inasmuch as many suburban schools are doing so poorly that it would be unreasonable to hold them up as examples of privilege.
Those tempted to turn to funding as the answer and insist that Rhode Islanders should devote even more money to public education across the board have to contend with national comparisons that suggest otherwise. The PARCC results reinforce and amplify the reality that education has become a moral issue of civil rights, in Rhode Island, and raising taxes isn’t the solution. Moreover, inside-the-system reforms have proven to have a political ceiling. That leaves dramatic changes in the areas of school choice and labor reform, and a generation of children does not have time to wait for insiders to shore up their personal well-springs.
