State in Decline, Employment in RI Cities and Towns: Cumberland
Cumberland is somewhat unique in Rhode Island, inasmuch as it saw increases in population, labor force, and employment from 2000 to 2010. Among those that the Current has reviewed thus far, the only other town that can say the same is West Greenwich.
Of course, because Cumberland’s labor force grew more quickly than its employment, the town’s unemployment rate increased along with Rhode Island’s, although it stands at 10.4%, not seasonally adjusted, compared with the state’s 11.8%. From 2000 to 2010, Cumberland’s population grew 5.2%; its labor force expanded 9.6%; and its employment showed a rare-for-Rhode Island increase, of 1.1%.

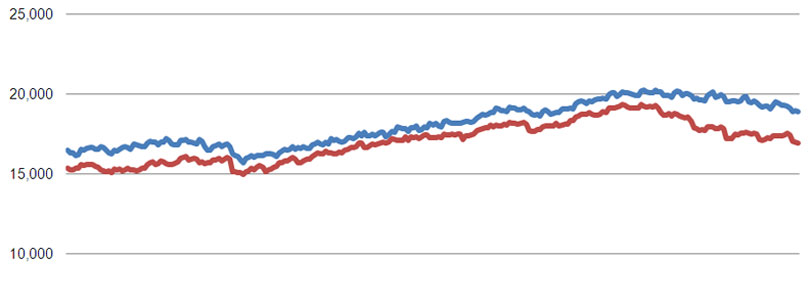
As the following graph illustrates, however, by 2010, Cumberland was sliding down from a housing-boom peak, with employment fading more quickly than labor force. In March, the town’s labor force was well above its twenty-two-year average, but its employment was a little below its own average. As a result, the number of unemployed residents is closer to the high set in February 2010 than to the average.
Unemployment is shown as the distance between the two lines.

Note on the Data
The population data above comes from the U.S. Census conducted every ten years and is therefore generally considered reliable, to the extent that is used as reference for various government programs and voter districting.
The labor force and unemployment data, however, derives from the New England City and Town Areas (NECTAS) segment of the Local Area Unemployment Statistics (LAUS) of the federal Bureau of Labor Statistics (BLS). A detailed summary of the methodology is not readily available, but in basic terms, it is a model based on and benchmarked to several public surveys. It can be assumed that the sample rate (i.e., the number of people actually surveyed) in each Rhode Island town is very small (averaging roughly 30 people per municipality).
The trends shown, it must be emphasized, are most appropriately seen as trends in the model that generally relate to what’s actually happening among the population but are not an immediate reflection of it. Taking action on the assumption that the exact number of employed or unemployed residents shown corresponds directly to real people in a town would vest much too much confidence in the model’s accuracy.
Be that as it may, the data has been collected and published, and taken a town at a time, it is relatively easy to digest. So, curiosity leads the Current to see it as the best available data to deepen our understanding of trends within Rhode Island. If the findings comport with readers’ sense of how the towns relate to each other, perhaps lessons regarding local and statewide policies may be drawn. If not, then the lesson will be on the limitations of data in our era of information overload.