A Daily Test for Models
A couple of days ago, I suggested that Democrat Governor Gina Raimondo has an obligation to explain to Rhode Islanders what the models on which she’s basing her COVID-19-related decisions actually show. One big reason for that obligation is so the public can judge her actions with full information. Again, an emergency doesn’t make us subjects; it makes us sovereign individuals who consent to temporarily cede a little more power to government.
Instead, the governor has made vague references to some model with which the state is working, and she’s even gone so far as to approach academics with whose model she disagreed, inspiring them to revise it toward scarier predictions:
The revisions, Raimondo said, came after “consultations” with the state, The state has been working with the people behind the IHME model for four or five days, Raimondo said. The model had assumed 100% compliance and stricter regulations than would even be feasible here, according to Raimondo.
After Monday’s changes showing a sharp uptick in projected deaths, “we think it’s now more accurate,” Raimondo said. Raimondo said the peak could be anywhere from mid-April to mid-May.
Obviously, we can’t know how accurate the Institute for Health Metrics and Evaluation (IHME) model will prove to have been in a month or two from now, but we can trace it day to day, and so far, it has dramatically overstated reality.
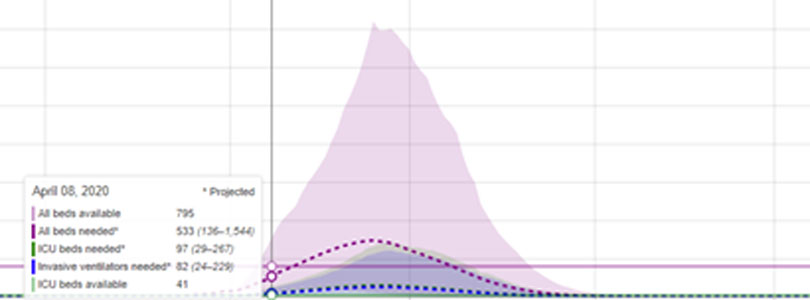
For today, April 8, the model projects that Rhode Island needs 533 of its 795 available hospital beds, with 97 needed ICU beds already overwhelming the 41 such beds available, with 82 people on invasive ventilators:
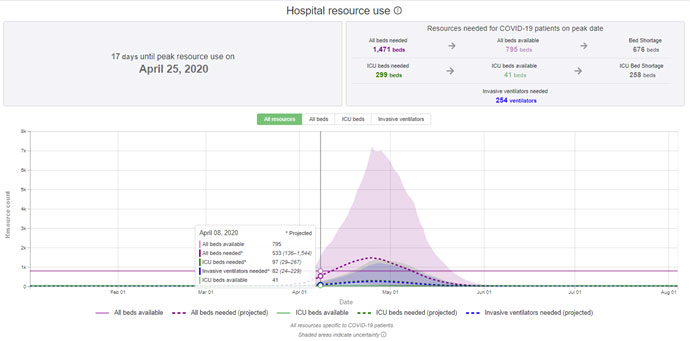
So what is Rhode Island actually seeing on the 8th of April? 143 patients are hospitalized, not 533. Only 45 of those are in intensive care (and I’m not sure the “41 available beds” number is accurate, by the way).
Looking at deaths presents a similar picture, although thankfully with much smaller numbers. The most notable thing about the IHME death chart for Rhode Island is what looks like visual fudging of the chart, as if they corrected the prior day’s death number to reality but forgot to recalculate everything else.
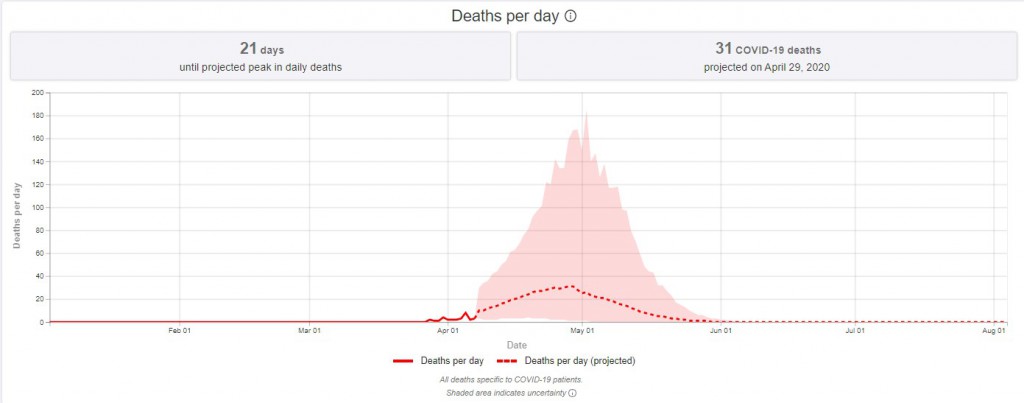
According to this chart, Rhode Island should be seeing 10 deaths per day attributable to COVID-19. The actual number for today was five, after three and two in the past two days.
Of course, it’s important to affirm again and again that these numbers could shoot up, but that acceleration seems always to be in the future. The IHME’s projection for total deaths in RI is at the moment 848, with a minimum of 105 and a maximum of 3,422. If that number keeps getting revised down, we’ll start to get into a range in which an increase in despair-and-anxiety-driven suicides and overdoses, could be a bigger number of actual deaths from COVID-19 as we race toward 20 or 30% unemployment.
I still haven’t seen any attempt to model those results, and I don’t expect the governor to pressure any academics to provide one. For some sense of what such a model might show, however, consider a 2017 study published by the National Bureau of Economic Research, which found that a one percentage point increase in unemployment corresponds with a 3.6% increase in opioid deaths and a 7% increase in emergency room visits. That year, Rhode Island experienced 277 overdose deaths, which would suggest 17 additional overdose deaths for every month the state spends at 25% unemployment.