Games with Models, April 16 Data
OK, let’s take a risk and have some fun. Yesterday, I noted a few things about the COVID-19 model that the governor is using to make decisions:
- She doesn’t show a best-case scenario.
- She shows roughly four times as many hospitalizations right now than there actually are.
- She doesn’t explain the assumptions that lead her to project a nine-times increase over the next few weeks.
As I keep insisting, American citizens aren’t children. We’re adults who deserve a role in public decision-making based on honest facts presented by our government. So, what should the governor be doing?
Well, all of her assumptions should be placed on the table, to the finest detail, even though most Rhode Islanders would have no interest in it. No doubt, the state government is looking to good, smart people for its answers, but our state is full of good, smart people, and it is foolish to rely entirely on only a handful of them.
Then, if we’re going to have a public proclamation of the death count every day, it should also include a comparison with the projection and an explanation about how the new data affects the projections going forward. This approach gives a great deal of perspective. I’ve been running a very simple (actually, simplistic) model, which has pointed to much lower numbers than the government is predicting. And just about every day, the actually numbers have come in lower than I would have predicted. Meanwhile, a common refrain in my social media interactions has been that I ought to shut up and let the experts do what needs to be done without input from the public.
This brings to mind an episode of the EconTalk podcast released back in that other world, 2019. Psychologist Gerd Gigerenzer explained the thinking behind his book, Gut Feelings, which suggests that simple heuristics (or rules of thumb) are often preferable to complex models. Think about it. Every detail in a complex model builds in new assumptions that might or might not be correct.
A rule of thumb gives a very broad range of possibilities based generally on experience, but builders of complex models will often ignore that experience if the math of their assumptions says something different. Thus, we get decisions about our state’s entire economy and our children’s education based on a model that doesn’t accurately illustrate the experience of the past week, let alone the future.
So in the name of science, I’ll take the risk of laying out the model I’ve been playing with. I’m not making any claims about being an expert, so don’t take this as a prediction. It’s more like a hobbyist trying to see how close he can get to a working machine. The appropriate (scientific) approach of those who disagree would be to point out what I might be missing and to show how that would change the results. As a hobbyist, I’d love to improve my understanding and my ability to improve my own projections.
Here’s how it’s built. Regarding total cases:
- I’ve taken the actual cases of COVID-19 as reported by the state government. (This should make my projections too high, at the moment, because we had an increase in testing during that time inflating the trend.)
- To project the future trends, I multiply today’s results by the average daily increase of the past week, which I adjust for (i.e., multiply by) the change in the 14-day infection rate for the past week versus the week before.
Another bit of data the governor hasn’t provided is some estimate of “active” cases. At what point should we stop counting people as “infected” and start thinking that they are healthy and (probably) immune? For my model:
- I assume that a case is “active” for an average of 14 days. (Some people are sick for longer, but 14 days plus three days of being symptom free has generally been the guideline for returning to work. This assumption might overstate the number of active cases because people probably aren’t generally tested until they’ve had symptoms for a day or two, and then it has taken some days to get results back.)
- Thus, for each day, the “active” cases equal the total cases for that day minus the total cases two weeks prior.
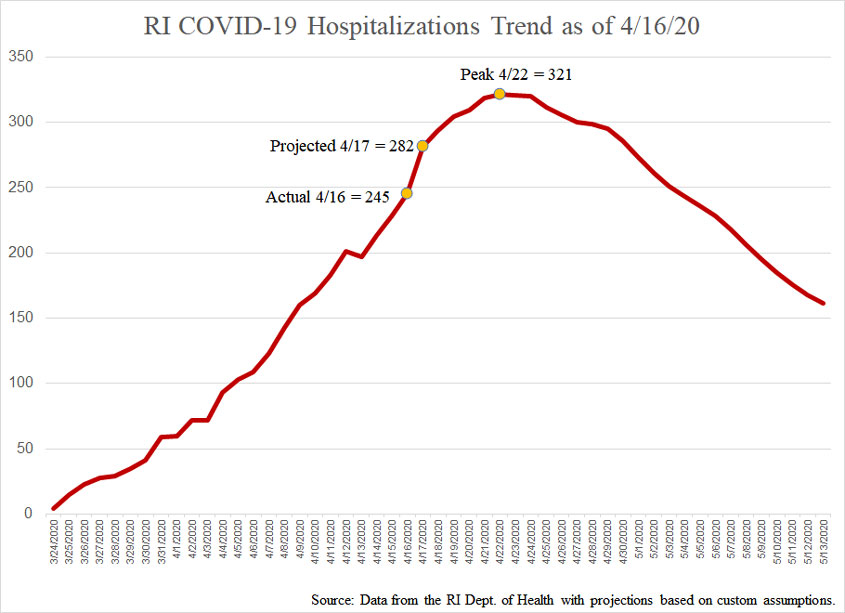
As of the data released on April 16, the total cases numbered 3,838, and the active cases numbered 3,181. By this simplistic trend, the peak for active cases will come next Tuesday, with 3,896 active cases.
To project future hospitalizations:
- I calculate hospitalizations’ percentage of active cases each day.
- Then I average that ratio for the past week and apply it to my projections of active cases going forward.
- This method doesn’t work well for the down slope (because the average ratio of hospitalizations to active cases starts to go up even as the active cases goes down), so I halted the chart shortly after the peak.
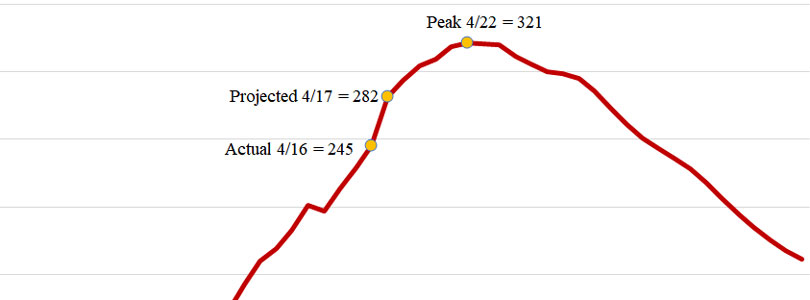
The results for hospitalizations are shown in the following chart. It predicts that the governor will announce 282 people in the hospital when she gives her statement this afternoon and that Rhode Island will hit its peak next Wednesday, with 321 people in the hospital dealing with COVID-19.

Now, this could be completely wrong, and if so, I look forward to trying to figure out what I missed. Each day, I’ll post an updated chart that shows how reality and new projections relate to earlier charts.
One of the things I like about this approach is that it is entirely based on observed trends, so it points directly to the key question: If the future is going to be different, what is going to change? In that context, I’ll end with a list of what three models are projecting to happen between now and the peak of hospitalizations:
- RI Dept. of Health: from 245 to 2,250 in 17 days.
- IHME: from 245 to 942 in 16 days.
- Me: from 245 to 321 in 6 days.
Let’s see what happens!


