A Growing NAEP Gap for the Disadvantaged
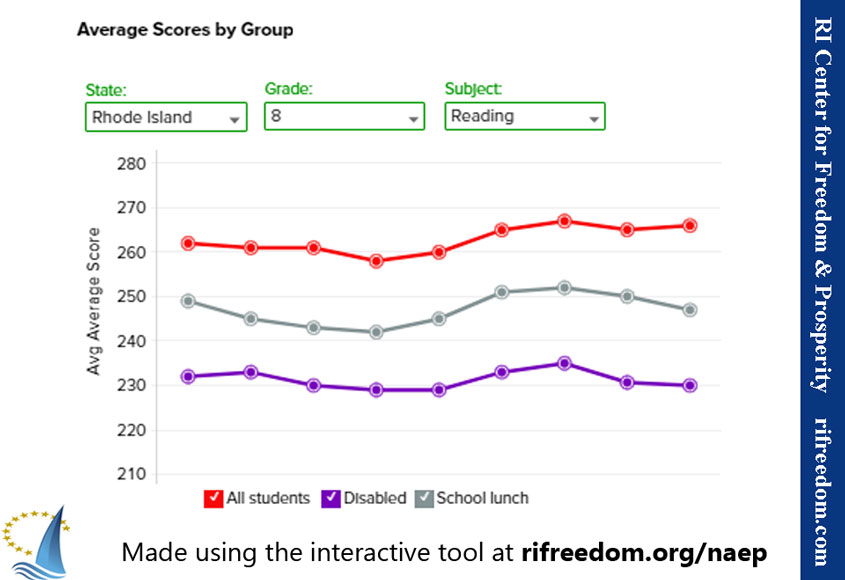
Here’s a worrisome trend made visible on the RI Center for Freedom & Prosperity’s interactive tool for comparing scores on the National Assessment of Educational Progress (NAEP) test. The lines show results on the 8th grade reading test among Rhode Island students. The red line represents students overall; the gray line represents lower-income students (as determined by eligibility for free or reduced lunch); and the purple line represents students with some sort of learning, emotional, or physical disability.
That there would be a gap between the average student and students with marked disadvantages isn’t surprising. That the gap is growing particularly because the disadvantaged students are losing ground ought to be a huge red flag.
[box type=”note” style=”rounded”]To Our Readers: We need your support to challenge the progressive mainstream media narrative. Your donation helps us deliver the truth to Rhode Islanders. Please give now.[/box]