What Job Creation Versus Job Destruction Says About Rhode Island’s Economy, Part 4 of 4
At the close of the previous part of this series, I ended with the claim that the insider culture in Rhode Island may be helping some established people maintain their standard of living (somewhat), but the system is driving out exactly the people with the most incentive to innovate and work. One obvious place to look for some light on this claim (once you’ve stumbled across it, of course) is the Nonemployer Establishment Statistics data set that the U.S. Census provides on an annual basis.
The following chart shows the growth of this group compared with the annual trends for employment and Rhode Island–based jobs. Because the magnitude of each group is different, I’ve marked the actual numbers for each line at the beginning and the end of the period.
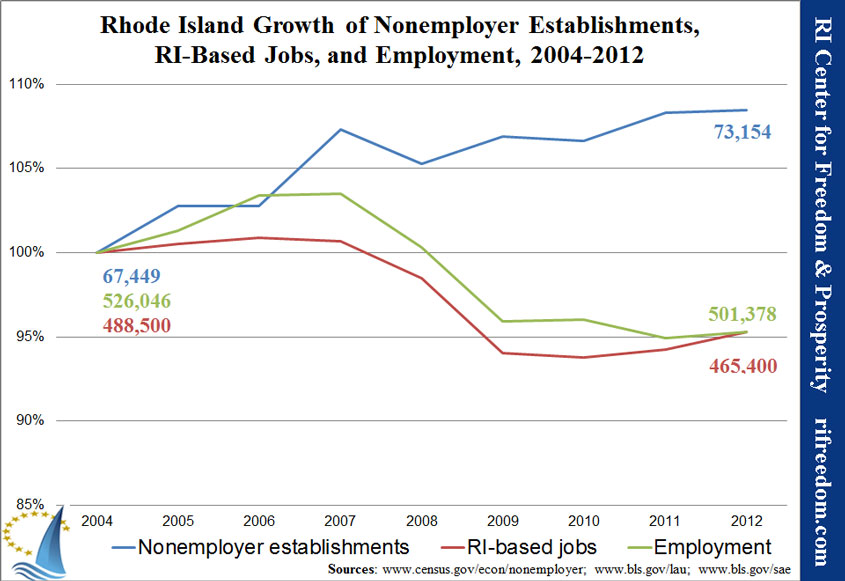
This chart brings out two things that require explanation in terms of my theory of Rhode Island’s employment trends. First, the one post-recession year of notable change is 2011, and it shows nonemployer establishments and total employment going in opposition directions, which is contrary to my theory. That observation, however, probably has to do with the differing nature of the two data sets, for reasons I’ll explain in a footnote for those who are interested, because it’s tangential to my argument.*
The second observation that requires explanation is that, after a big jump at the start of the recession and a partial backslide the next year, nonemployer establishments have been going up. By my theory, we’d expect to see these self-employed people on the decrease as the RI-based jobs from established companies took their place. Why is that not shown, here?
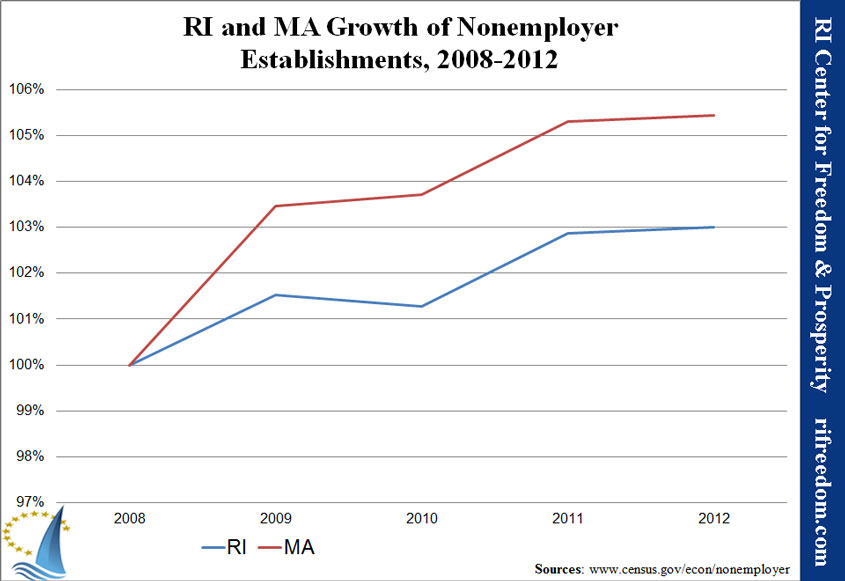
For a partial answer, I’d like to bring things back to Massachusetts, because in comparison, Rhode Island’s nonemployer establishments have been relatively stagnant, up around 3%, while Massachusetts was up around 5.5%.
The context of our neighboring state aside, it may not be possible to develop conclusive data at this level of detail. The differences in the data sets that I mention in the aforementioned footnote play a role. Additionally, we have to acknowledge that between 2,000 and 3,000 establishments that have employees go out of business each year, in Rhode Island, and each of them has a boss who wasn’t counted among nonemployer establishments or RI-based jobs, but who was counted as employed.
Part of the explanation, though, probably has to do with the way all of the different factors interact with and counteract each other. The nonemployer establishments are only 14-15% of the employment figure, so it’s possible that even slight trends creating more part-time employment with established companies or decreased employment of Rhode Islanders in other states could swamp the numbers, even as the self-employed define the larger trend.
That said, sorting through the nonemployer establishments by the industries in which they work makes for some interesting findings that accord with my interpretation of Rhode Island’s problem. Among such establishments, we find people inventing new industries mixed with people scraping together a living by cutting hair, watching pets, or whatever else they can get people to pay them to do.
For one thing, administrative services saw a big boost with the recession and have continued on a gradual increase. Because they provide mainly business-to-business services, their success probably indicates outsourcing, or a transfer of work from employees to contractors in order to save money.
By contrast, those working in professional, scientific, and technical services — which would be a likely candidate for innovation and new directions for the economy — have been pretty stagnant, and they represent the single largest group of self-employed people with no employees under them. Prior to the recession, this group was increasing at a steady pace, but since the recession hit in 2006/2007, they haven’t increased at all.
The biggest growth by far has been in the “other services” industry, so it’s worth breaking that down to even finer detail:
- Professionals in automotive repair and maintenance saw a substantial jump when the recession kicked in, suggesting that it was a refuge for some who lost their jobs, and they’ve just held on since then.
- Although they hit a plateau in 2012, personal care services, mainly hair and cosmetics, had been experiencing big growth, up almost 40% from 2006 to 2011. Notably, considering current legislation to make it harder for new people to enter the business, barbershops were up 43% from 2006 to 2012.
- Another area of growth, but one with a lot of volatility since the recession, has been other personal services. That includes everything from pet care (excluding veterinary) to parking lots. Pet care was up 74% from 2006 to 2012 (perhaps suggesting a protectionist motivation for whacking them with the sales tax a few years back). The largest subgroup, though, was up only 13% in that time frame and is the next level of catch-all: “all other personal services.” Such services include pretty much anything you can think of that one person might pay another to do on a random basis. Interestingly, this category actually stopped a steady growth when the recession hit and oscillated around stagnation until a jump in 2011.
In Conclusion
In a dynamic, growing economy in which the people who live in an area are exploring new directions that might suit them in the wake of a changing economic world, we’d want to see continual strong growth among nonemployer establishments, which (given the interest of the owner) take the next steps toward hiring and growing their businesses. That’s how a local economy can find the niche that the geography and population are uniquely suited to fill in the economy as it currently exists.
To some extent we have been seeing this trend, although it’s obscured by combination with individuals trying to make money at anything that’ll pay. Despite this mixing, though, it seems that Rhode Island’s business environment only lets the self starters get so far. About one-year after beginning to hire other employees, establishments start to struggle in Rhode Island more than they do in Massachusetts.
I’d suggest that we’re going about economic development all wrong, with our attempts at top-down, centralized decision making. Instead we should be:
- Making it easier and cheaper to hire employees. That means resisting calls to increase the minimum wage as well as to impose mandates on employers once they’ve hired people. (Although not unique to Rhode Island, ObamaCare is certainly suppressing job growth.)
- Setting policy in a way that serves people who are just starting out, probably without a lot of business experience. That means cutting taxes and regulations and giving both businesses and consumers the opportunity to take risks.
Rhode Islanders are managing to create jobs for themselves, somewhat, but they hit a wall when they start to really establish themselves. That’s when all of the rules start kicking in… when perhaps they hire accountants and consult lawyers who teach them that their business models can’t overcome all of the rules, fees, and taxes that they may not have known existed previously. You shouldn’t need to know how to get big-time capital investment or have an MBA in order to start a business, to learn as you go, and to build it into something that expands the economy for everybody.
Unless we get really lucky, if we fail to learn that lesson, we’ll face the fate I suggested in the previous iteration: Established businesses that have learned how to work Rhode Island’s insider system will continue to absorb more and more of the economy, somewhat preserving the living standard of people involved with them, but increasing the ability of the system to force others out. Those others, meanwhile, will take all of their skill and productive motivation out of the state, or maybe they’ll stay and, demoralized, just settle for something short of their dreams.
* There are four reasons that I’d argue the differing trends between nonemployer establishments and total employment is not fatal to my theory and is, in fact, a consequence of the differing sources. First, the fact that the chart shows percentages exaggerates the difference. In 2011, employment went down by 5,686 people, while nonemployer establishments went up by 1,126. Second, the data are collected in different fashions (a survey for employment and tax returns for establishments), so some variation is to be expected. Third, the employment numbers would catch people who fit within my theory but aren’t in the establishment numbers, such as self-employed people who actually have employees and those who would say that they are employed but either don’t declare their income or just don’t count as organized establishments for some reason. Fourth, the establishment numbers are a tally of people who declared income from a business at some point throughout the year, while the employment numbers are the average for the employment estimates for each month. Suppose 12 people each had self-employment income for one month in a given year. The nonemployer numbers would, I believe, count all 12 of them, but the employment numbers would average them by month, so collectively, they’d count only as one person for the whole year.
