What Job Creation Versus Job Destruction Says About Rhode Island’s Economy, Part 2 of 4
New Companies Versus Established Companies Matters
In the first post in this series, I looked at why a new, anonymous Rhode Island commentator takes too narrow of a view of the state’s job creation, breaking down the state’s data into hirings versus firings. It isn’t a contradiction to suggest that he or she also takes too broad of a view, considering the data from a different perspective.
For his or her purposes, CoffeeBlack combines the job gains from establishments that were newly opened in the quarter with those from establishments that expanded and had a net increase in employees. These are two different groups and ought to be considered as such.
The following chart shows the job creation rates for establishments that either opened or expanded in each quarter in 2012 (which looks pretty comparable to other recent years). As CoffeeBlack notes, Rhode Island is in line with — indeed, exceeding — the performance of Massachusetts, and you can see that the trend holds for both opening and expanding businesses. But there’s more that this view reveals.
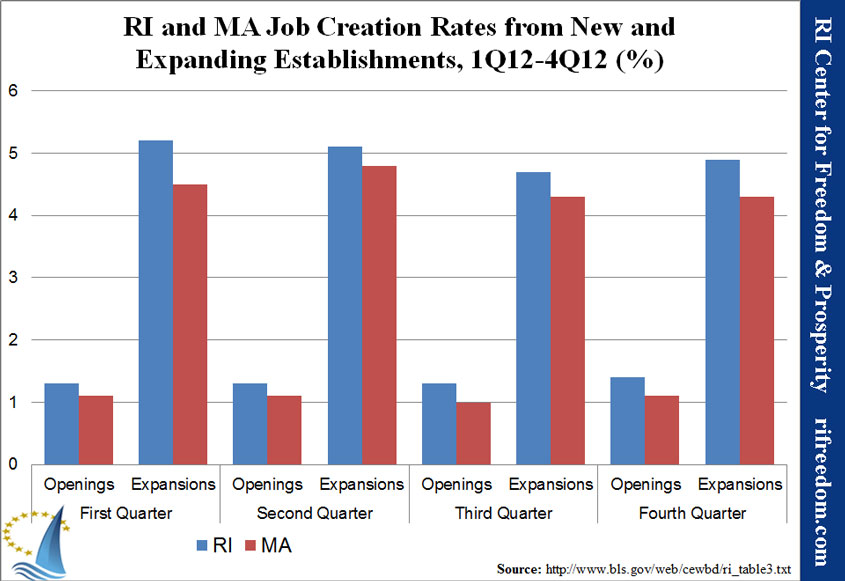
First, note that not only are expansions a much bigger part of the total than openings, but Rhode Island’s edge is greater in expansions, as well. That looks like Rhode Island is humming with hiring, no?
Let’s take a step away from the quarterly data that CoffeeBlack uses, and take in the annual data available from the U.S. Census.
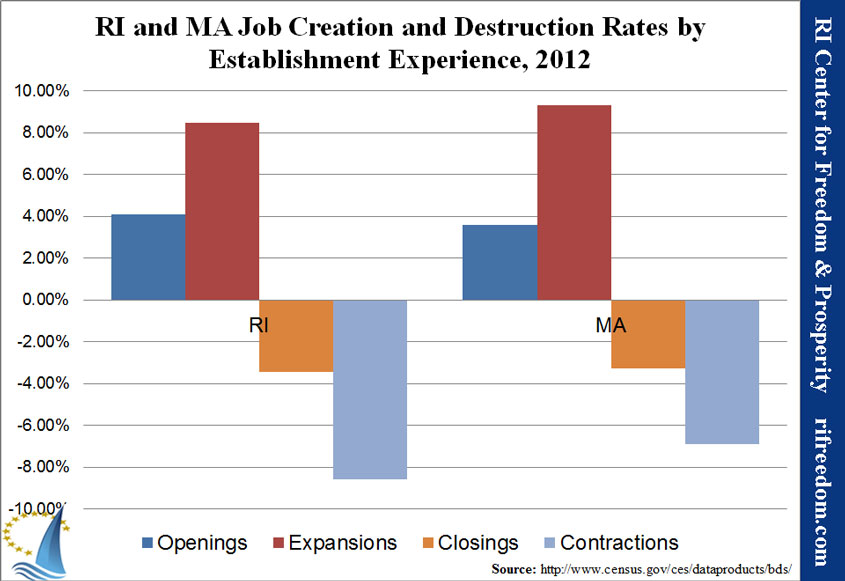
See what happens there? Rhode Island’s advantage in jobs due to establishment births is not what the quarterly data would suggest, if it were cumulative. As for expansions, Massachusetts actually surpasses Rhode Island in job creation when we look at the change in jobs over a year.
Note that I’m using 2012 because it is the latest data available by this measure, and the results vary by year. However, looking at combined birth and expansion rates for 2004 through 2012, the following are true:
- For cumulative quarterly gains, Rhode Island outperformed Massachusetts in every year.
- In every year, Rhode Island’s advantage in cumulative quarterly gains was larger than its advantage in annual gains.
- In five of the nine years, Massachusetts actually wound up creating more jobs year over year.*
Why would the data change like this? Well, Rhode Island’s job market is apparently more volatile. Establishments start-up and expand at a greater rate, but they struggle as the quarters roll along.
I’d propose that CoffeeBlack’s analysis, as I understand it, is backwards. He or she seems to suggest that Rhode Island’s high opening/expansion results’ being overwhelmed by its high closing/contraction rates implies that it isn’t the “business environment,” but something more intrinsic in the economy. Looking more specifically at the numbers, it actually looks like Rhode Islanders are very determined and hopeful, when it comes to starting businesses and trying to make a living, but the “business environment” makes it extremely difficult for them to maintain their workforces or even to stay open.
This conclusion is reinforced if we dig into the data showing openings, expansions, closings, and contractions based on the age of the establishment. First though, a quick note to point out that CoffeeBlack incorrectly uses “firm” and “establishment” interchangeably. A “firm” is essentially a company; an “establishment” is essentially a location. I’ll give some explanation of why this is important in a moment, but for now, it’s enough to know that the following table covers establishments and that we’re looking at annual data.
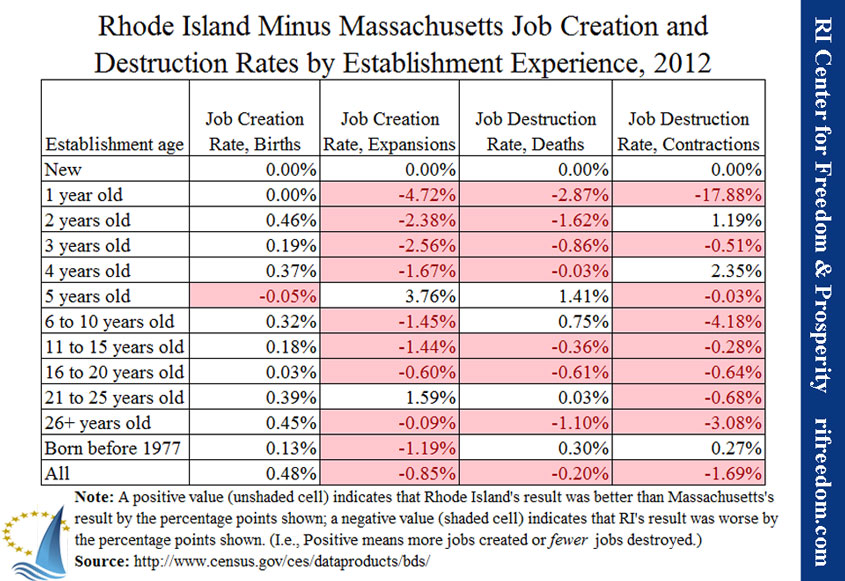
The most striking thing is that Rhode Island does pretty well creating jobs through the birth of new establishments.** That could have something to do with incentive programs, but I’d wager it has more to do with the desperation of all the people who’ve lost their jobs.
The next thing that jumps out is how much worse Rhode Island establishments do than Massachusetts establishments when they’re one-year old. Again, that could indicate that Rhode Island’s difficult business climate wipes out a higher proportion of newer firms and/or it could indicate that Rhode Islanders who aren’t quite ready to be operating businesses are starting them simply to keep working.
Rhode Island and the Deaths of Firms
I noted above that “firms” are different from “establishments.” For many intents and purposes in the state-level context, the distinction isn’t all that important. However, it’s relevant, here, for two reasons.
First, CoffeeBlack suggests one partial explanation for Rhode Island’s high rate of closures and contractions might be “a problem of succession like the one presently confronting Germany’s mittelstand.” That would mean that businesses are closing mainly because nobody wants to take them over (which the owners’ children would often do). This, the anonymous blogger suggests, would be an especially difficult problem for public policy to address.
Based on the Census data, though, it would be difficult to make the case that this is what’s happening. Data on firms is sparse, but the Census does give a total of job losses from firm deaths. These are the jobs that disappear because the entire company goes out of business. Rhode Island seems typically to be very close to Massachusetts on this measure, and for 2012, the rates are almost exactly the same (0.02 percentage points different). Put simply, companies’ going out of business does not explain the difference between the two states, so succession probably does not either.
The second reason this is relevant is that 40% of the jobs lost due to closing establishments in 2012 were from companies that lived on elsewhere. Whether that elsewhere was within Rhode Island or someplace else isn’t to be found in this data. It’s certainly not encouraging to realize that an establishment death that wasn’t accompanied by a firm death could occur if a company with a single location picked up and moved to another state.
Next up: How wages and income relate to the jobs numbers.
* A comparison of job destruction rates isn’t as relevant to this discussion as it was in the previous post, but it’s interesting, nonetheless. Once again, Rhode Island had higher rates for cumulative quarters, once again the difference with Massachusetts isn’t as dramatic on an annual basis, and once again, some of the annual results actually switch signs, meaning that, in some years, Massachusetts actually had a greater job-destruction rate than Rhode Island. There’s a telling difference, though: For job creation, the years in which Massachusetts exceeded Rhode Island on an annual basis are spread out: 2005, 2006, 2008, 2010, and 2012. For job destruction, by contrast, all of the years in which Massachusetts exceeded Rhode Island (i.e., had a greater destruction rate) were at the early end of the range, from 2004 to 2007. In every year after the recession began, Rhode Island had a higher rate of lost jobs.
** I’m not sure how there can be job creations at establishments that are multiple years old. Readers should note, though, that, though the Census does calculate rates, the actual numbers are very small. Only a few hundred jobs are created in establishments that are reported as newly born even though they’re a few years old, suggesting that these data points are the result of unique circumstances. Of 16,682 jobs created in Rhode Island due to establishment births in 2012, 14,068 of them were created by new establishments.


