Concluding a Strange Season for Employment Data
An unanticipated (unprecedented) leap in employment just prior to this year’s presidential election brought the Current Population Survey (CPS) data from the Bureau of Labor Statistics (BLS) an unusually high degree of technical scrutiny. As I’ve been noting, the seasonally adjusted and unadjusted results have been a bit peculiar. With data from December now available, the BLS concluded the year by changing five years’ worth of seasonal adjustments and announcing changes that will make subsequent years “not directly comparable” to anything that came before.
For the final month of the year, the “headline” unemployment number, which is the percentage of people in the labor force who say they are actively seeking work, held at 7.8%. Two frequently highlighted considerations are that, one, certain demographic groups are way above that percentage and, two, the rate would be significantly higher if the American labor force hadn’t slowed its pace. If the labor force of the last five years had continued to grow at the rate of the prior five years, the unemployment rate would be 8.6%.
But it’s the difference of seasonal adjustment that illustrates the peculiarity of this year. Seasonal adjustment shifts the employment changes around within the year in order to reduce the effect of changes that happen annually, so that we can see larger scale trends that give better evidence about the health of the economy.
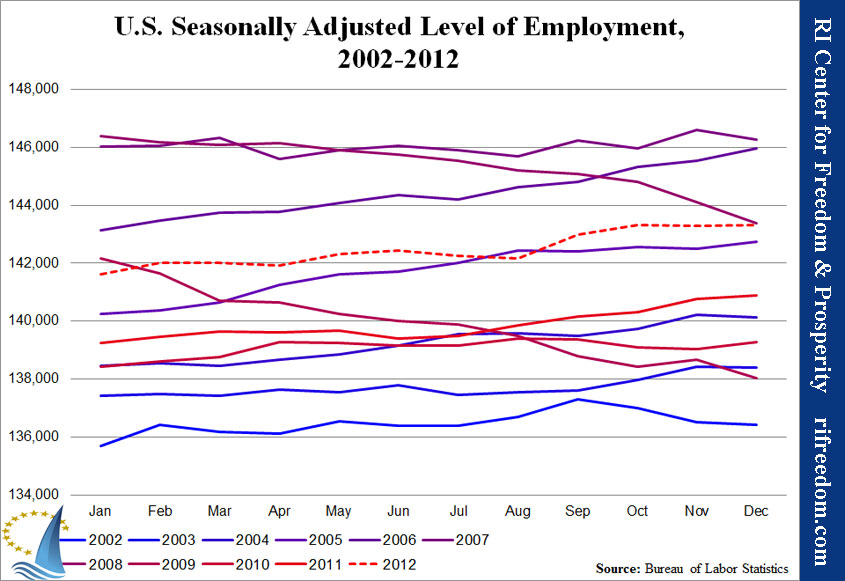
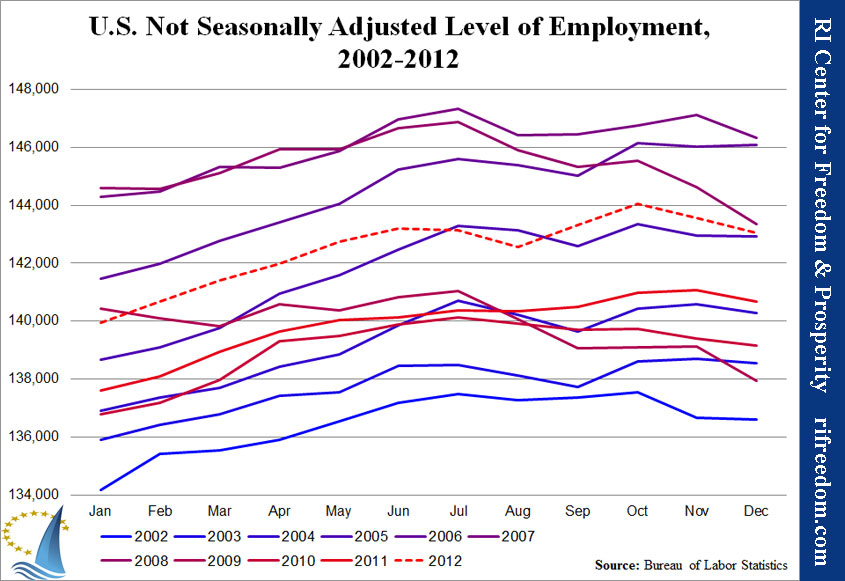
You may have to spend a moment with the following charts, because they’re a little confusing at first look. One tip is that any given year begins in January reasonably closely to where the prior year left off in December.
Each chart shows the monthly number of Americans who say that they are currently employed. The bluer the line, the older the data; the redder the line, the newer the data. The dashed line is 2012. The first chart shows the data seasonally adjusted, which is the more common way of reporting the numbers; the second chart shows them without the adjustment.
The seasonally adjusted story of 2012 is utter stagnation with a big, unusual upswing from August to October. Without the seasonal adjustment, the story is a typical increase in employment for the first half of the year and late-summer down-slide followed by an unusually large and consistent spike in October, the month before the election.
Regarding the seasonally adjusted chart, the end of year change in past numbers — which a BLS spokesman tells me happens every year, always addressing the previous five years — reduced the big autumn jump by 9.3%. That is, the seasonal adjustment for the months leading up to September raised the line up, while the peak in October shifted down and the next month, November, increased a bit. (For some reason, September’s number didn’t change at all.)
So, in the “raw” unadjusted numbers, we see a strange jump, which the seasonal adjustment de-emphasized, and the revised numbers de-emphasized it further. But if you’re thinking that it would be interesting to see how all these lines develop over the coming year, you’re out of luck. This is from the BLS news release, this morning (emphasis added):
Effective with the release of The Employment Situation for January 2013, scheduled for February 1, 2013, new population controls will be used in the monthly household survey estimation process. These new controls reflect the annual updating of intercensal population estimates by the U.S. Census Bureau. Historical data will not be revised to incorporate the new controls; consequently, household survey data for January 2013 will not be directly comparable with that for December 2012 or earlier periods. A table showing the effects of the new controls on the major labor force series will be included in the January 2013 release.
It will certainly be interesting to see which way the new methodology shifts the numbers.


