Employment: October Surprise or October Miracle?
A lot of people who watch policy and politics relatively closely were very surprised, this morning, to hear that the unemployment rate had fallen to its lowest level during the Obama presidency — a level last seen in January 2009. As James Pethokoukis notes, of the seasonally adjusted 873,000 jump in employment from August to September, 582,000 were people who want to work full-time but had their hours cut or were unable to find full-time work, involuntary part time, as they’re called.
Given the sheer size of the jump in employment, though, some cynical folks on the political right are finding it to be a bit suspicious. In their view, the move would be in keeping with the Obama administration’s request to defense contractors not to notify employees before the election of possible layoffs and promise to cover the cost if they are sued for it.
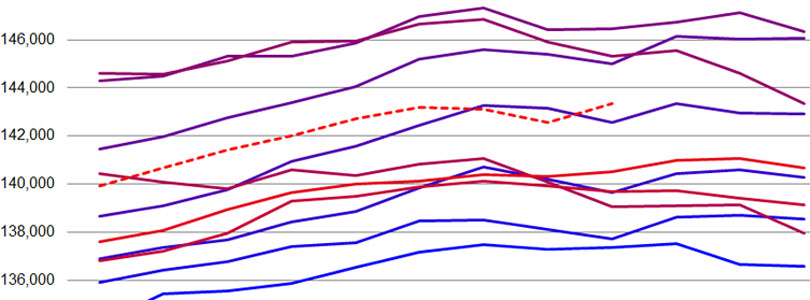
Whether one’s inclined to believe such things, the leap is surprising enough to justify notice. Consider the following two charts. For the last decade, they show each year’s month-to-month level of employment; the first is seasonally adjusted, and the second is not.


The earlier lines are bluer, and the later are redder, with 2012 dashed. The Bureau of Labor Statistics adjusted the data in the first chart to account for seasonal shifts in the job market, so that other trends would be more visible. And it’s clear that this year’s August-to-September change was larger than any prior year.
What the second chart shows, though, with those adjustments removed, is that it is actually pretty unusual for employment to increase much at all during those months. In fact, in most of the years of the last decade, it’s gone down.
As a matter of fact, not seasonally adjusted, the number of employed residents went up 775,000 from August to September, which is the highest Aug-Sept change over the last decade. The average is a drop of 241,000, leading to a difference of this period from the average of 1,016,000.
That is the biggest variation from the average for any month-to-month period over on the charts. The next largest is January-to-February 2002, which produced 845,000 higher employment than the average for the last decade.
None of this proves that anybody has done anything wrong, statistically. It is odd, though, that the country would see this huge, unusual jump and that it would come as a surprise. Supporters of the president might go so far as to call it a miracle, especially after Republican candidate Mitt Romney performed so well in the debate two nights ago.
Addendum: Noel Sheppard on NewsBusters points out that September’s was, out of nowhere, the biggest month-to-month jump in employment since June 1983. That’s true, as far as it goes, but it’s true of the seasonally adjusted numbers. Taking away the seasonal adjustments to the raw employment data shows that it wasn’t anywhere near the greatest increase. However, the really large jumps are more common in March and June.