Employment Revision: 3,729 RI Workers Disappear
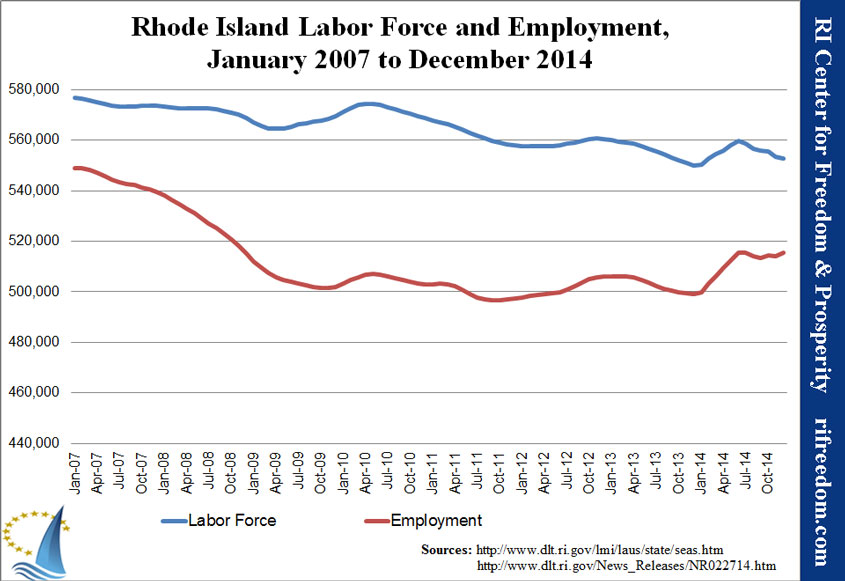
The annual revision to the nation’s employment data included the substantial revision that we’ve been predicting, around here. In fact, the number of Rhode Islanders employed in December dropped by 3,729. If that had been the number originally reported, the unemployment rate would have stood at 7.4% in December, having never gone below 7.0%.
Naturally, the Bureau of Labor Statistics also revised the total number of people working or looking for work (the labor force) downward, too — by 3,855 people. So the whole exercise was pretty much a wash, albeit one that leaves Rhode Island’s working economy that much smaller and farther from its pre-recession peak.
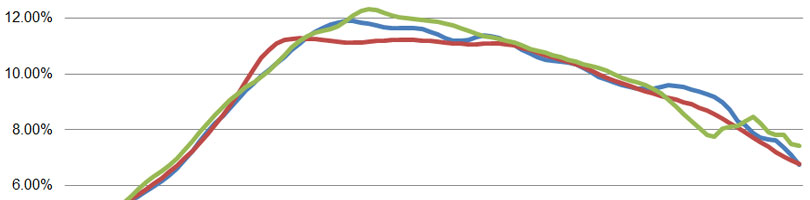
Although, not as much farther as one would have thought. The BLS also went back years, seemingly to smooth everything out. Rhode Island’s peak employment dropped by 1,611. A chart of the revised unemployment rate looks different in a conspicuous way.
On the following chart, the blue line is the pre-revision unemployment rate, which touched the 12% line before beginning to drift downward. The red line is follows the revised data, and has the state just barely above 11% and just hovering for almost three years.
The green line shows how that magic was accomplished; it’s the revised employment number using the pre-revision labor force. During those three years, the BLS just revised the labor force down near the peak employment and then up enough to cancel out the downward drift in employment.
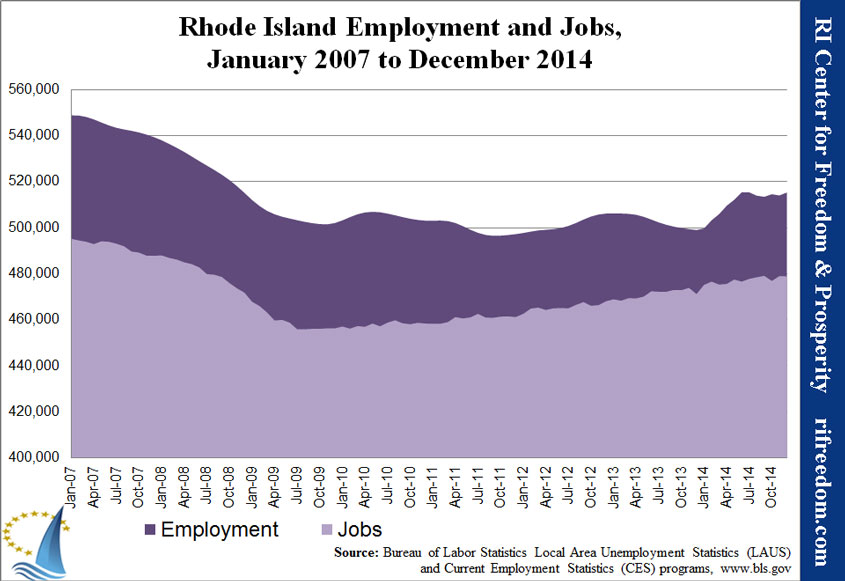
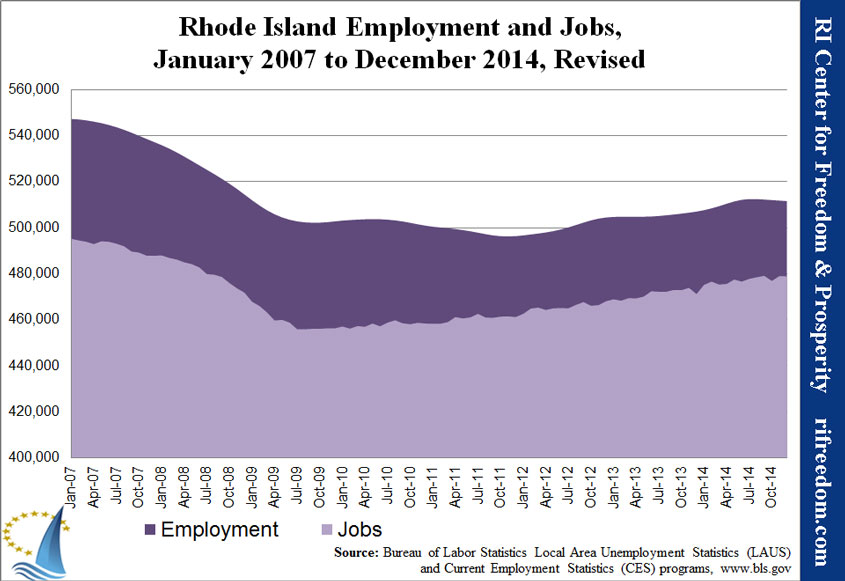
 The method appears again in the latter half of 2013 and beginning of 2014. To eliminate the appearance of an employment decline and an inexplicable surge of massive employment gains, in the Ocean State, the BLS simply adjusted employment to increase gradually and adjusted the labor rate to keep the unemployment rate smooth, too. To illustrate the method, I’ve presented the pre-revision labor and employment chart next to the revised version.
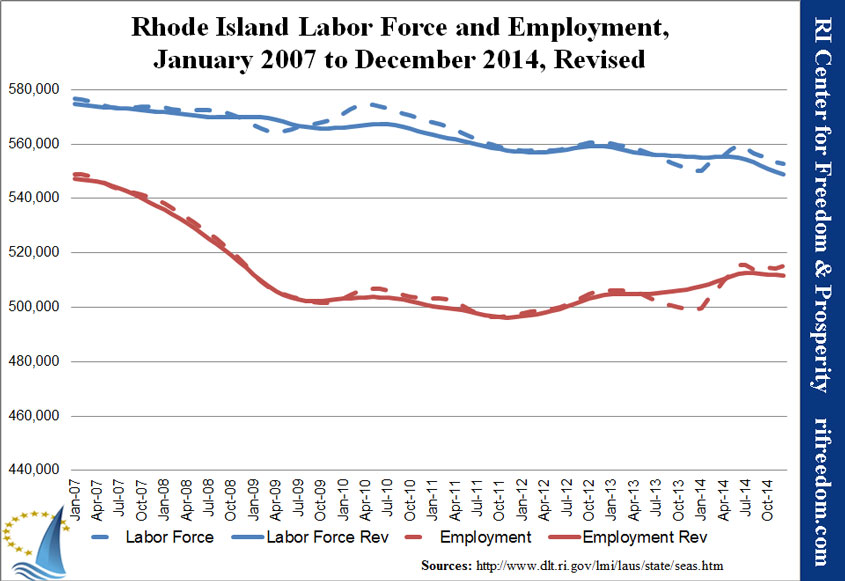
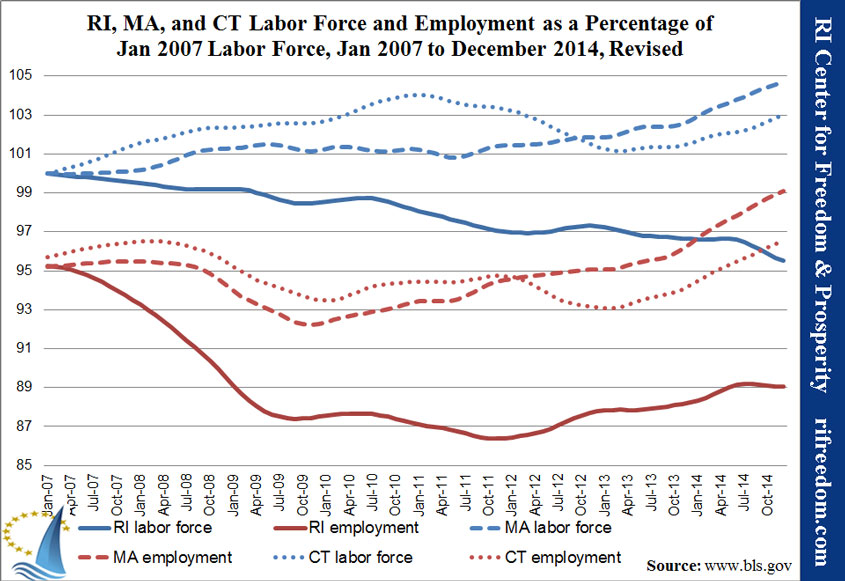
Whatever the ability of revisions to improve the story that Rhode Island tells about itself, there’s only so much that can be done when the state is put in context. Here are the charts comparing Rhode Island with its neighbors, before and after the revision.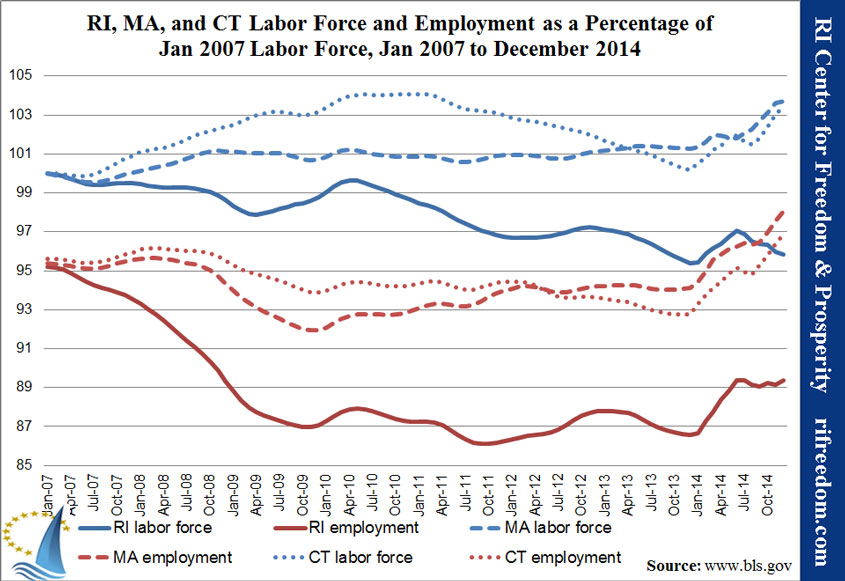
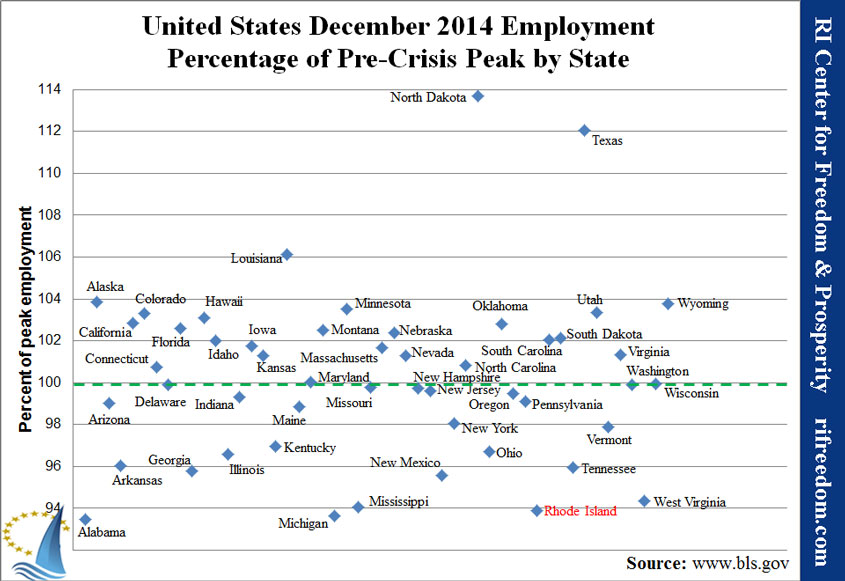
The chart of each state’s distance from its pre-recession peak employment shows that the revisions significantly worsened Rhode Island’s relative standing.
 Lastly, the revised version of the employment versus RI-based jobs chart shows tells pretty much the same story, but the contrast in a stable jobs increase and a volatile employment market has been smoothed out of existence. That said, the gap between the two narrowed, so it’s even more true that the established-jobs market is absorbing the more fluid (and innovative) jobs market.