First Quarter Single-Family Home Sales Picture Mostly Bleak in RI
For most cities and towns in Rhode Island, an analysis of real estate transactions in the first quarter of 2012 compared with the first quarter of 2011 does not paint a rosy picture.
Today’s RISC-Y Business newsletter from the Rhode Island Statewide Coalition (RISC) included a link to a blog post by Keith Jurow of Business Insider titled “The Truth About the ‘Housing Bottom’: Home Prices Across the Northeast Are in Total Freefall.” In support of the title’s claim, Jurow “spent several days” investigating local real estate data available through the William Raveis Local Housing Data tool, comparing February 2012 sales to February 2011 sales.
From Rhode Island, Jurow listed the dropping median sales prices of three communities: Providence, down 5.5%, Warwick, down 12.2%, and Pawtucket, down 18.3%. With the Current’s more-specific interest in Rhode Island, however, I thought I’d see what the data shows for all of the available cities and towns. Finding that the data is now available through March, I thought a more complete picture would be drawn by using the “three months ending” tables — that is, the data for the first quarter of the calendar year.
The table below compares single-family home sales for each city and town in the first three months of 2012 against the first three months of 2011. Shading of cells indicates a negative number. Depending on the statistic in question, negative numbers aren’t necessarily bad. In the column showing the amount that the town’s personal real estate inventory has changed, for case in point, a reduced number of houses on the market means people are buying more quickly than people are deciding to sell, which is likely to drive prices up.
Consequently, the condition most likely to indicate that the bottom of the market has been reached and recovery is underway would be increasing sales, decreasing inventory, and increasing median prices. In Rhode Island, those circumstances are only present in Foster. (It’s important to note the small number of houses involved there, though.)
Conversely, the least hopeful snapshot of the data exists when there are fewer sales in a market with greater inventory, with those houses that do sell going for less money. That is the case in Barrington, Exeter, Smithfield, Tiverton, and Woonsocket. The most common situation in this data is of increasing sales, rising inventories, and falling prices.
Looking at the drop in median sales price, the five worst-performing towns were:
- Warren (-33.3%)
- Barrington (-30.7%)
- Scituate (-29.2%)
- Hopkinton (-26.3%)
- Woonsocket (-21.3%)
Median sales price doesn’t tell the whole story, however. If prices have dropped while sales are up and inventory is down, that could indicate that the bottom of the market has been reached and a turnaround is beginning. That appears to be the case in Glocester and Little Compton.
Purely for an idea of where the cities and towns stand when all three trends are taken into account, the Current created a “downward spiral index” that adds the changes in sales and median prices and subtracts the change in inventory. No attempt was made to weight each factor, and real estate professionals may provide local considerations that merit adjustments.
In order from most-bleak to least-bleak, the 18 communities with negative “downward spiral” scores are:
- Central Falls (note the very small sales base, however)
- Woonsocket
- Tiverton
- Exeter
- Smithfield
- Barrington
- Portsmouth
- East Greenwich
- Richmond
- Warren
- Warwick
- Bristol
- Providence
- South Kingstown
- Cranston
- North Kingstown
- West Warwick
- East Providence
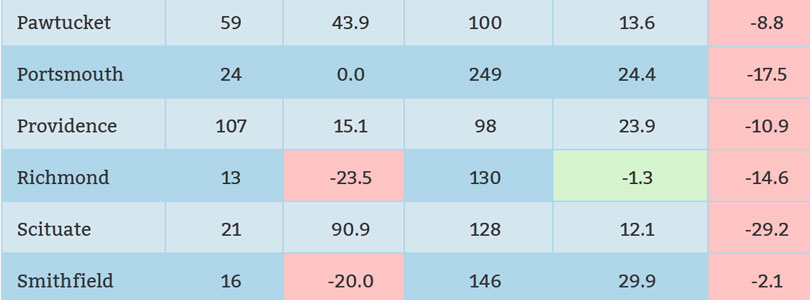
Rhode Island Cities and Towns Single-Family Home Sales, 1Q11 to 1Q12
| Sales | Sales change (%) | Price per Sq. Ft. | Inventory change (%) | Median sales price change (%) | |
| Barrington | 33 | -8.3 | 193 | 5.2 | -30.7 |
| Bristol | 21 | 0.0 | 172 | 10.8 | -10.3 |
| Burrillville | 25 | 47.1 | 118 | 9.5 | 1.3 |
| Central Falls | 4 | 33.3 | 56 | 128.6 | -2.5 |
| Charlestown | 34 | 61.9 | 247 | 15.8 | 13.5 |
| Coventry | 91 | 56.9 | 116 | 3.7 | 6.9 |
| Cranston | 118 | 18.0 | 173 | 15.4 | -16.9 |
| Cumberland | 77 | 63.8 | 144 | 5.5 | -11.4 |
| East Greenwich | 26 | 0.0 | 179 | 28.7 | -10.4 |
| East Providence | 56 | 7.7 | 118 | 3.9 | -10.2 |
| Exeter | 11 | -31.3 | 152 | 20.0 | -2.9 |
| Foster | 11 | 83.3 | 125 | -28.2 | 37.7 |
| Glocester | 20 | 81.8 | 135 | -2.4 | -1.3 |
| Hopkinton | 15 | 150.0 | 127 | 35.1 | -26.3 |
| Jamestown | 11 | 10.0 | 357 | 6.5 | 19.5 |
| Johnston | 62 | 34.8 | 104 | 2.7 | -3.0 |
| Lincoln | 32 | 45.5 | 144 | 36.9 | -7.2 |
| Little Compton | 7 | 16.7 | 394 | -10.6 | -12.9 |
| Middletown | 21 | 90.9 | 251 | 15.5 | -2.7 |
| Narragansett | 43 | 138.9 | 252 | 13.5 | -10.1 |
| Newport | 32 | 28.0 | 255 | 8.7 | 6.0 |
| North Kingstown | 48 | 6.7 | 179 | 23.5 | 6.5 |
| North Providence | 52 | 33.3 | 113 | 2.7 | -6.9 |
| North Smithfield | 19 | 18.8 | 130 | 0.0 | 3.6 |
| Pawtucket | 59 | 43.9 | 100 | 13.6 | -8.8 |
| Portsmouth | 24 | 0.0 | 249 | 24.4 | -17.5 |
| Providence | 107 | 15.1 | 98 | 23.9 | -10.9 |
| Richmond | 13 | -23.5 | 130 | -1.3 | -14.6 |
| Scituate | 21 | 90.9 | 128 | 12.1 | -29.2 |
| Smithfield | 16 | -20.0 | 146 | 29.9 | -2.1 |
| South Kingstown | 50 | 6.4 | 186 | 19.6 | -4.0 |
| Tiverton | 20 | -23.1 | 131 | 21.9 | -11.2 |
| Warren | 10 | 11.1 | 147 | 13.0 | -33.3 |
| Warwick | 185 | 4.5 | 118 | 23.9 | -6.1 |
| West Greenwich | 9 | 80.0 | 126 | 27.5 | 8.7 |
| West Warwick | 44 | 46.7 | 99 | 39.6 | -15.9 |
| Westerly | 40 | 8.1 | 355 | 11.3 | 10.8 |
| Woonsocket | 24 | -22.6 | 71 | 28.8 | -21.3 |