Games with Models, April 25 Data
Today’s COVID-19 report for Rhode Island came with a mildly better turn. Hospitalizations continued their downward trend, although not as dramatically as I’d hoped. The number of new cases was up by quite a bit, but the rate of increase did slow a bit after five days of seeming stuck around 7%. And the number of deaths was up double digits, but more than half of the increase arrived as revisions to earlier numbers.
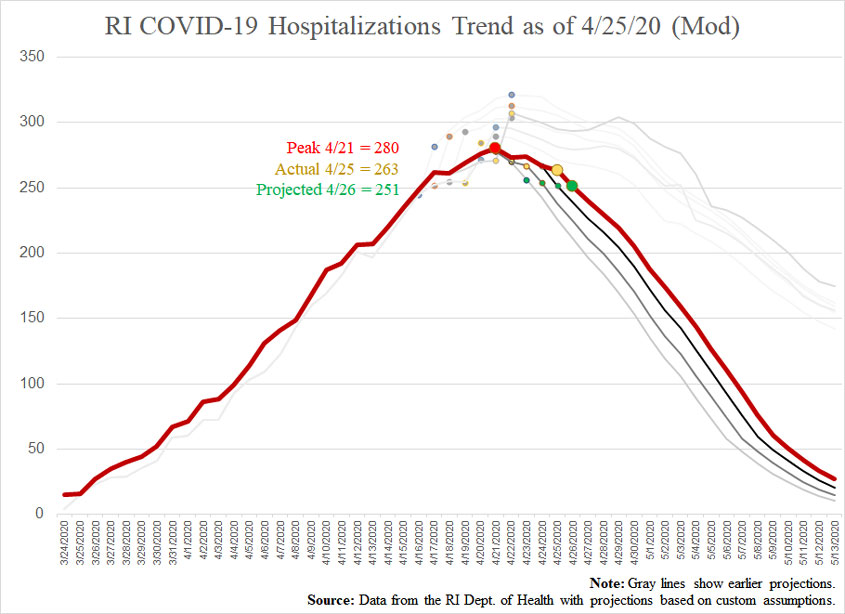
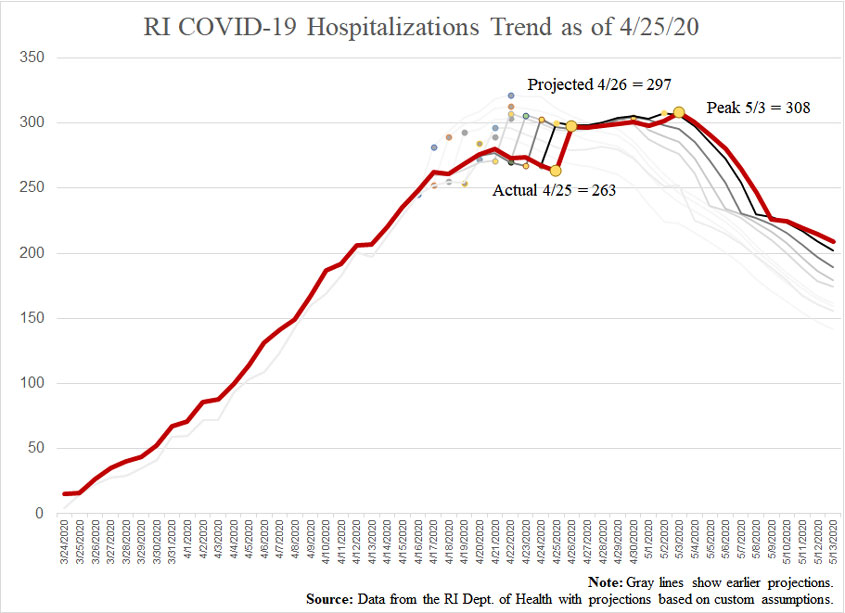
These trends resulted in the following two updated charts. (See here for the original methodology and here for the modification.) By way of a reminder: I include the non-modified chart mainly as a record of my original model.
- Cases:
- Projection for 4/25: 6,954
- Actual for 4/25: 7,129
- Projection for 4/26: 7,393
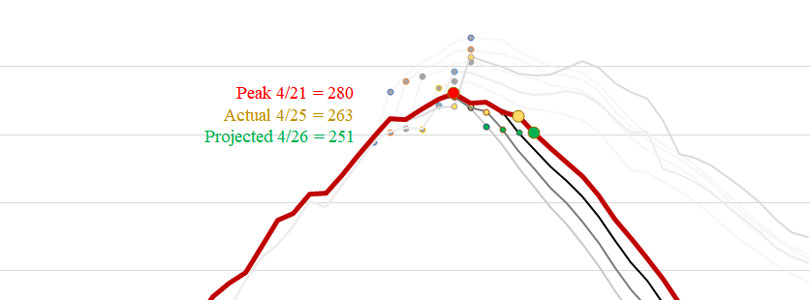
- Hospitalizations:
- Projection for 4/25: 252 (original method = 300)
- Actual for 4/25: 263
- Projection for 4/26: 251 (original method = 297)
- Deaths:
- Projection for 4/25: 210
- Actual for 4/25: 215
- Projection for 4/26: 223