Howard Is Dishonest, but at Least He Pretends to Debate
I’ll give this to Sam Howard: At least he tries. Most progressives just go with insults and a tone of superiority, asserting that the person with whom they disagree is so obviously wrong that the reason doesn’t merit explanation. At least Howard tries to explain.
And when somebody tries to explain, that means the other person can respond, and everybody involved (or watching) can try to figure out what’s at the core of the disagreement. In this case, it seems to me that the core of the disagreement is that Howard’s attempt at an explanation only goes far enough to give a partial argument, while still relying on the self-righteous tone and insults to fill in the gaps.
In this endeavor, he writes as if he has found errors in my basic math. The image he appends to a tweet promoting his post is of the equation, “1 + 1 =3.” But his arguments have little to nothing to do with math, and mostly to do with aesthetics and an unshakable faith that I must be wrong.
So, he posts a chart that he doesn’t like from my regular employment series in this space. His reason isn’t that any math is wrong. He just thinks that one of the five or six charts that appear in those posts illustrates a point in a way he doesn’t like. It’s not the math that’s wrong, in his view, but the vocabulary. He doesn’t like that I called Rhode Island an “outlier” for job recovery… eight years ago.
Next, he posts another chart that he doesn’t like from the RI Center for Freedom & Prosperity’s Freedom Index series… four years ago. What’s funny, here, is that Howard points out something that’s clear on the chart as evidence that the chart somehow obscures it. There’s no real substance to his complaint, though, and certainly no math. Indeed, there’s a good bit of dishonesty. Howard provides no link to the object of his criticism and misleads his readers by suggesting that the chart he doesn’t like is the whole thing. “A table would’ve been a better way to display this ‘data.'” I don’t disagree. That’s why the actual report presents seven tables and two other charts. (Note: I like the spiral chart not to compare Republicans and Democrats, but because it’s interesting to watch from year to year.)
But these are all just warm-ups by which Howard hopes to establish some sort of pattern of misleading math on my part. The subject about which he’s concerned is a recent post in which I suggest that focusing on race and COVID-19 doesn’t appear to be helpful in Rhode Island, most especially because it is skewed by a single RI city that is by far the most densely populated and by far the most Hispanic.
Here we have more of both the humor and the dishonesty of Howard’s essay. He spends two paragraphs on how he couldn’t make my math make sense before he acknowledges that if you follow the link that I provided and find the data I cited, it works out. He does correctly point out that I’d mislabeled two numbers as cases per person per mile. I’ve corrected and explained the reason for my error in the original post. That’s not bad math — he figured it out readily — but something more like a typo.
This is where one begins to wonder if Howard understands what math is and why it helps us understand the world around us:
This isn’t a just “different finding” in Donnis’ phrasing. It’s just bad (and deceptive) math. You don’t divide the raw number of cases in a town by its population density, because population density is an estimate of a single square mile, and the disease is not contained to a single square mile of a particular town.
With such a calculation, Katz doesn’t really demonstrate anything beyond that when a denominator is larger than the numerator, the result is a small number; and the smaller the denominator, the larger the result.
There is a lot to unpack here. First, notice that his first objection isn’t to me at all, but to the Public’s Radio reporter Ian Donnis. I didn’t call my article a “different finding,” but rather, it was an argument that racial findings with respect to COVID-19 in Rhode Island seem to distract from more-relevant factors. Nowhere do I write that the numbers of different groups who have tested positive for COVID-19 were wrong.
Second, one of the key reasons math is so important as a language is that it allows us to understand concepts that aren’t readily visualized or put into words. Population density isn’t just an estimate of an abstract square mile; it’s a rate that measures something real. For a disconnected example, think of the math behind string instruments, where the velocity of a vibration in a string is the square root of the amount of tension divided by its linear density. In our case, the tension is the infection rate and the density is the “mass” of people for every square mile.
Third, Howard’s explanation of how fractions work evades the key point, which is exactly that the denominators are different. If disease spreads more readily in a place that is densely populated, then you would expect the numbers to be higher in that area. If race is an additional factor, then the next question is whether the sickness in the population is higher or lower than what you would expect in a population of that population density.
To illustrate the point I was trying to get at, consider the following four representations. I used Central Falls and Pawtucket because their relative populations, sizes, densities, and numbers of infections made them easy to compare. (Note that these aren’t intended for comparison from one set to the next; they’re only to compare the two cities in each set.) If we look at cases per capita, Central Falls has about twice as many infections. If we look at cases per square mile, Central Falls has about four times as many infections. But Pawtucket is about eight times as big as Central Falls and has about 3 2/3 as many people, so if we look at total infections, Pawtucket approaches nearly twice as many.
Now to the last set. As Howard notes, cases per population density is an abstraction, which is why we need mathematics in order to discuss it. So, the illustration below is just an attempt to represent the abstraction of the numbers. Dividing the cases in Central Falls by the population density yields 0.03; for illustration, I’ve represented that across 100 dots. The same number for Pawtucket is about 0.12, but since Pawtucket is about half as densely populated as Central Falls, I’ve represented that across 50 dots in the same-sized area.
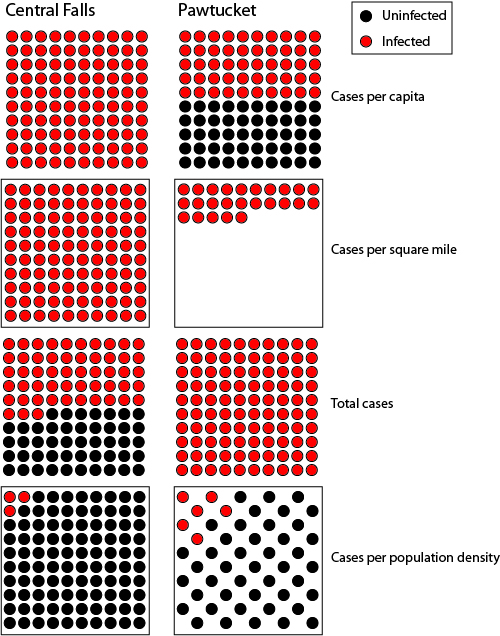
So, in this arbitrary area of space, three out of 100 units in Central Falls are infected, while six out of 50 units in Pawtucket are. Why is that? I don’t know; there are way too many unknown variables. But I wasn’t trying to prove what the number should be, only that race doesn’t explain the discrepancy.
Apparently, neither does population density, perfectly. That’s why Howard’s reference to Newport really doesn’t prove anything, especially his attempt to shove everything into ranks of municipalities. For all his talk about math, you’d think he’d understand that the order in which cities might be put on a list by some measure doesn’t make them evenly spaced. The drop-off in population density is huge — from about 16,000 per square mile in Central Falls to 9,000 in Providence and 8,000 in Pawtucket, with big jumps down from there. Newport may be the “eighth most-dense” city in the state, but every municipality outside of the three or five most dense is so much more open than Central Falls that other factors could easily overwhelm density for the transmission of disease (mix of industries, style of housing, size of families, etc.).
If you want to argue that the race of the residents has some causal effect, you should argue that the red dots in that final Central Falls box would have been even fewer if its population were less Hispanic. On that point, Howard doesn’t even try. In fact, he almost resorts to arguing my case: ” a large part of what causes COVID-19 spread is people infecting others in their living or work areas. When people are unable to isolate, they infect others.” This is population density.
Howard then goes on to list a number of other factors that might affect the spread of disease, and they all have one thing in common: None of them are race or ethnicity. It’s easy to imagine how poverty, type of job, size of family, and so on could play a role in transmission, but jamming all of that into racial categories distracts from the actual causes, especially because it brings in the specter of racism, which makes it much more difficult to discuss anything in a clinical way in our society.
But clinical discussion clearly isn’t what Sam Howard is interested in doing.
Toward the end of his essay, Howard observes that I pointed out that the majority of deaths are among white Rhode Islanders. Howard: “what Katz omits, and is crucial, is that while he does have the racial and ethnic composition for both RI and its COVID-19 fatalities correct, that includes Rhode Islanders of all ages.”
Simply put, he’s lying. In the very next sentence after the one to which he referrs, I write, “Of course, this is because the disease is almost exclusively fatal to older people, and they are more likely to be white in Rhode Island, right now.”
All of his snide rhetoric and dishonesty leads to Howard’s real reason for writing, which is to lament that anybody would dare link to me to provide readers a different point of view, claiming I write in “bad faith.” He’s got that backwards. I’m expressing a point of view in the hopes of challenging fashionable assumptions and starting discussions. As I’ve proven above, if somebody presents an actual argument, I’ll gladly mull it over and debate it.
If that’s not your thing, then don’t click the link, but don’t unleash a barrage of insults and lies in order to claim that I’m the one acting in bad faith. It’s truly sad that Sam Howard stands out not for his personal attacks and dishonesty, but because he’s at least willing to pretend to debate.