March 2014 Employment: Another Boom That Nobody Feels
Earlier in the week, the Rhode Island Department of Revenue released data for March, showing that tax revenue was way below projections for March, particularly income taxes. Specifically, income tax revenue was down $13.6 million, or 26%. Sales and use tax revenue was up $404,027, or 0.6%, but overall state government revenue for the month was down $27,586,944, or 8.3%, from what the government expected.
In February, income tax revenue was down slightly, $75,266, or 0.3%, while sales and use tax revenue was up a hair ($102,443, 0.2%). Total revenue was up $10,414,772, or 6.5%, mainly on the strength of general business taxes, including on energy.
Yet, somehow, with these negative or tepid results, the employment data from the Bureau of Labor Statistics suggests that Rhode Islanders experienced a boom of employment in those two months, up more than 4,000 people since January. A look at the long-term trend of labor force and employment shows how significant that jump is:
As I suggested last month, these inexplicable booms have been happening every year for the past few, only to be revised downward (sometimes after an election cycle has run its course).
Even with the statistically questionable turnaround, Rhode Island’s relative fortunes are largely unchanged. Whatever’s happening, it’s also happening in Connecticut and Massachusetts:
Note, in particular, that if these numbers are accurate, Massachusetts has very nearly recovered its lost employment since the beginning of the downturn.
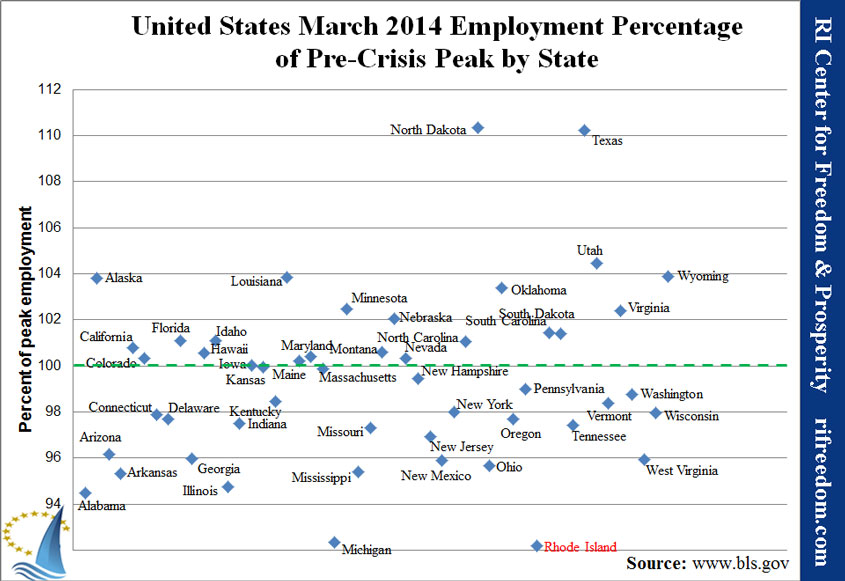
Unfortunately, this pattern carried throughout most of the country, so Rhode Island remains at the back of the pack for recovery to peak employment.
By a metric that isn’t relative to other states, at least Rhode Island can say that this unprecedented (and unlikely) boom has brought us back to where we were, in employment, at the bottom of the national trough, in February 2010. And at least we’ve slipped past Connecticut slightly, in the race out of last place.
My last monthly chart in this series shows a switch in the usual trend, in that the number of jobs based in Rhode Island (the light area) went down while the number of employed Rhode Islanders above and beyond that number (the dark area) went up. Because the dark area includes people whom the light area doesn’t (notably people who are their own bosses and people working out of state) while the light area has people who aren’t included in the dark area (people from out of state and people with more than one part-time job, counted multiple times) some interesting speculation is possible about this turnabout.
The most plausible explanation remains, however, that the employment numbers are simply not accurate and will be revised down by a significant margin (once again).


