State in Decline, Employment in RI Cities and Towns: Woonsocket
Not surprisingly, Woonsocket’s not-seasonally-adjusted unemployment rate for March was well above the state’s overall, with 13.4% versus 11.8%. In fact, the number of employed residents has not been lower during the twenty-two years covered by RI Dept. of Labor and Training statistics.
Like a few other RI cities and towns, the percentage of Woonsocket’s residents participating in the job market (working or looking for work) went up from the 2000 U.S. Census to the 2010 edition, but the percentage actually working went down.
As the following chart shows, over the course of the last decade, Woonsocket’s population fell 4.7%. That was accompanied by a 1.5% increase in the city’s labor force, but an 8.2% drop in its number of employed residents. Of the cities and towns that the Current has reviewed thus far, only Middletown and Newport saw larger decreases in employment.

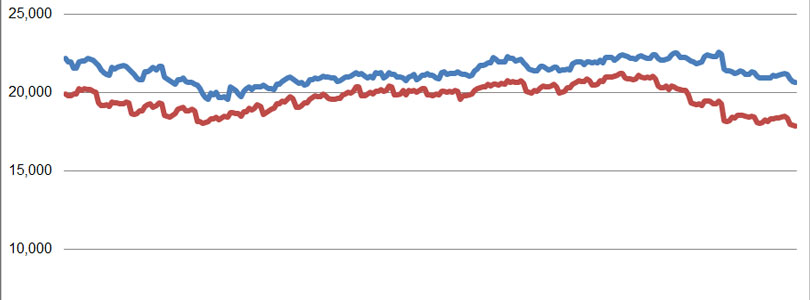
The following chart shows that Woonsocket’s number of employed residents has never been lower during the period under review. In fact, the only reason its unemployment rate has remained relatively stable over the past two years is that residents are leaving the labor force as quickly as they’re losing their jobs. If the labor force had remained the same, from 2010 to 2012, Woonsocket’s unemployment rate would be 16%.
Unemployment is represented, in the following chart, as the distance between the two lines.

Note on the Data
The population data above comes from the U.S. Census conducted every ten years and is therefore generally considered reliable, to the extent that is used as reference for various government programs and voter districting.
The labor force and unemployment data, however, derives from the New England City and Town Areas (NECTAS) segment of the Local Area Unemployment Statistics (LAUS) of the federal Bureau of Labor Statistics (BLS). A detailed summary of the methodology is not readily available, but in basic terms, it is a model based on and benchmarked to several public surveys. It can be assumed that the sample rate (i.e., the number of people actually surveyed) in each Rhode Island town is very small (averaging roughly 30 people per municipality).
The trends shown, it must be emphasized, are most appropriately seen as trends in the model that generally relate to what’s actually happening among the population but are not an immediate reflection of it. Taking action on the assumption that the exact number of employed or unemployed residents shown corresponds directly to real people in a town would vest much too much confidence in the model’s accuracy.
Be that as it may, the data has been collected and published, and taken a town at a time, it is relatively easy to digest. So, curiosity leads the Current to see it as the best available data to deepen our understanding of trends within Rhode Island. If the findings comport with readers’ sense of how the towns relate to each other, perhaps lessons regarding local and statewide policies may be drawn. If not, then the lesson will be on the limitations of data in our era of information overload.
