State in Decline, Employment in RI Cities and Towns: Bristol and Warren
It isn’t surprising that Bristol and Warren differ from each other and their Bristol County neighbor, Barrington, when it comes to population and employment. But some of the differences might not be expected.
Most notably, Bristol’s employment picture arguably improved, from 2000 to 2010. Its population grew 2.2%; its labor force grew 5.6%; and its number of employed residents only fell by -1.6%.

Of course, the problem with having more people, with a growing percentage of them desiring to work, is that it translates into higher unemployment numbers. Over that decade, the 459 residents who constituted a 3.8% unemployment rate in 2000 increased to 1,335, for 10.4%, by 2010 (not seasonally adjusted). In March 2012, the numbers stood at 1,322 and 10.6%, with both the labor force and the number of employed residents having declined.
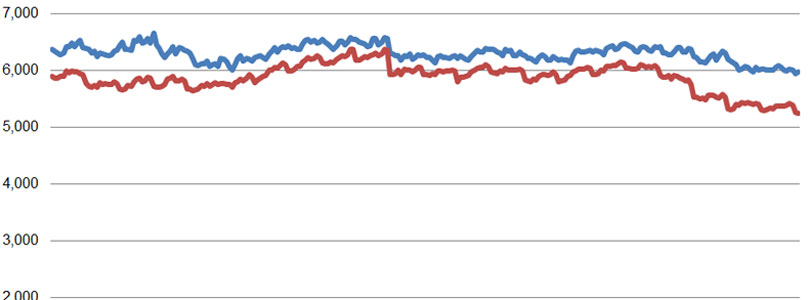
In the following graph, the distance between the two lines is the unemployment number.

Despite the downswing, the number of employed Bristol residents is only about three-and-one-half percent below its average for the past twenty-two years, and its unemployment rate still beats the state’s 11.8%.
Warren is another story. Not only is the town’s unemployment rate currently 12.1% (not seasonally adjusted), but it has declined by every measure: population was down 6.6% in 2010, compared with 2000; labor force was down 3.0%; and the number of employed residents was down 10.0%.

Because the drop in population was greater than the drop in the number of residents looking for work, an even greater portion of the population is seeking jobs and unable to find them. That could mean, for example, that struggling families are trying to supplement their income with additional workers and proving unable to do so.
In the twenty-two years for which the RI Dept. of Labor and Training has data, the number of employed Warren residents has never been lower. The only reason March’s total labor force number wasn’t the lowest on record is that it’s up slightly from January.

The peculiarity, in Warren, is that the labor force increased in February from January even as the number of employed residents decreased. In other circumstances, that might be a positive sign, meaning that more residents are optimistic enough to renew their searches for work. But with the towns on either side of Warren heading in the other direction, it’s more likely a statistical anomaly or evidence of desperation.
Note on the Data
The population data above comes from the U.S. Census conducted every ten years and is therefore generally considered reliable, to the extent that is used as reference for various government programs and voter districting.
The labor force and unemployment data, however, derives from the New England City and Town Areas (NECTAS) segment of the Local Area Unemployment Statistics (LAUS) of the federal Bureau of Labor Statistics (BLS). A detailed summary of the methodology is not readily available, but in basic terms, it is a model based on and benchmarked to several public surveys. It can be assumed that the sample rate (i.e., the number of people actually surveyed) in each Rhode Island town is very small (averaging roughly 30 people per municipality).
The trends shown, it must be emphasized, are most appropriately seen as trends in the model that generally relate to what’s actually happening among the population but are not an immediate reflection of it. Taking action on the assumption that the exact number of employed or unemployed residents shown corresponds directly to real people in a town would vest much too much confidence in the model’s accuracy.
Be that as it may, the data has been collected and published, and taken a town at a time, it is relatively easy to digest. So, curiosity leads the Current to see it as the best available data to deepen our understanding of trends within Rhode Island. If the findings comport with readers’ sense of how the towns relate to each other, perhaps lessons regarding local and statewide policies may be drawn. If not, then the lesson will be on the limitations of data in our era of information overload.