State in Decline, Employment in RI Cities and Towns: Portsmouth
At least among those that the Current has reviewed thus far, Portsmouth is pretty much the typical (as in average) town with respect to changes from 2000 to 2010.
The town’s population grew a little bit (1.4%). Its total labor force (working and looking for work) creased by 4.4%. And the total number of Portsmouth residents currently employed fell 2.6%

That Portsmouth may have followed the average line in change does not mean that it arrived at the average end point. As of March 2012, Portsmouth’s unemployment rate, not-seasonally-adjusted, was 10.6%, compared with the state’s 11.8%. However, the town’s labor force was a bit above its twenty-two-year average, while employment was slightly below, leading to a number of unemployed residents that is near the maximum for the period, set in January 2011.
It’s interesting to observe that the recession does not appear to have really hit Portsmouth until 2010, fully two years after most of Rhode Island. The town broke 10.0% unemployment for the first time in January 2010.
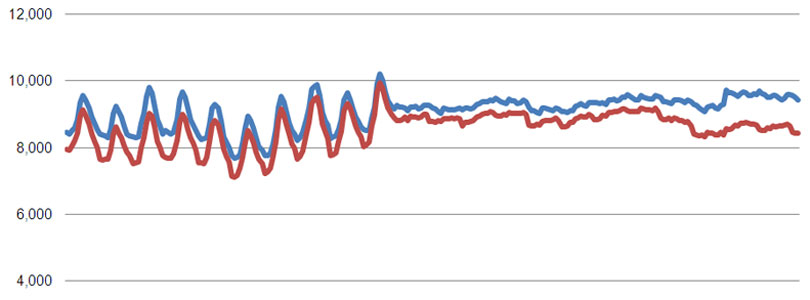
In a general way, it’s also interesting to compare the northern Aquidneck Island town with its neighbors. Although Portsmouth has clear seasonal waves, typically shifting by between two and three percentage points from winter to summer, its leaps are not as dramatic as Middletown’s and Newport’s, and the downsides do not last as long. A steep drop-off in employment in December is typically followed by a rocket up in April, so just three months are spent wallowing. Middletown’s swings appear to be between four and five percentage points, and its doldrums last five or six months, while Newport sees slightly wider gaps, with the downside lasting six or seven months.
In the following chart, unemployment is represented as the space between the lines.

The Current is not yet able to explain the stark change in the data around the turn of the millennium. The same adjustment is present in Middletown and Newport and is a helpful reminder that employment data relies especially heavily on U.S. Bureau of Labor Statistics models for small groupings like towns.
Note on the Data
The population data above comes from the U.S. Census conducted every ten years and is therefore generally considered reliable, to the extent that is used as reference for various government programs and voter districting.
The labor force and unemployment data, however, derives from the New England City and Town Areas (NECTAS) segment of the Local Area Unemployment Statistics (LAUS) of the federal Bureau of Labor Statistics (BLS). A detailed summary of the methodology is not readily available, but in basic terms, it is a model based on and benchmarked to several public surveys. It can be assumed that the sample rate (i.e., the number of people actually surveyed) in each Rhode Island town is very small (averaging roughly 30 people per municipality).
The trends shown, it must be emphasized, are most appropriately seen as trends in the model that generally relate to what’s actually happening among the population but are not an immediate reflection of it. Taking action on the assumption that the exact number of employed or unemployed residents shown corresponds directly to real people in a town would vest much too much confidence in the model’s accuracy.
Be that as it may, the data has been collected and published, and taken a town at a time, it is relatively easy to digest. So, curiosity leads the Current to see it as the best available data to deepen our understanding of trends within Rhode Island. If the findings comport with readers’ sense of how the towns relate to each other, perhaps lessons regarding local and statewide policies may be drawn. If not, then the lesson will be on the limitations of data in our era of information overload.