Unemployment Down… and That’s Not Good
From a Rhode Island Department of Labor and Training press release titled, “Unemployment Rate Drops to 10.9 Percent”:
The RI Department of Labor and Training announced today that the state’s seasonally adjusted unemployment rate for June 2012 dropped to 10.9 percent, down one-tenth of a percentage point from the May 2012 rate. This represents the second consecutive monthly decrease in the unemployment rate and is the lowest RI rate since January 2012 (10.9%).
Things must be turning around, then… right? Not at all. A closer look at the month-to-month results, from the Bureau of Labor Statistics, shows 430 fewer Rhode Islanders were working in June. The only reason the unemployment rate fell was that 1,589 fewer Rhode Islanders are even bothering to look for work. (Technically, 1,159 people fewer people were “unemployed,” but the 430 who lost their jobs either went straight to “not looking” or were matched one-for-one with previously unemployed who gave up.)

The press release highlights the fact that the unemployment rate hasn’t been this low since January. But if the same number of people were in the labor force in June as in January, unemployment would be 11.6%. Worse, if we carry the rate out another decimal point, unemployment is officially 10.85%, which is the lowest it’s been since June 2009. If the state’s labor force were still the same size that it was in that month, unemployment would be 12.3%.
That’s why the unemployment rate isn’t as useful a marker of the ongoing trends as people typically take it to be. Since Rhode Island’s peak employment in December 2006, the labor force has dropped by 21,910 people. If it hadn’t, unemployment would now be 14.2%.
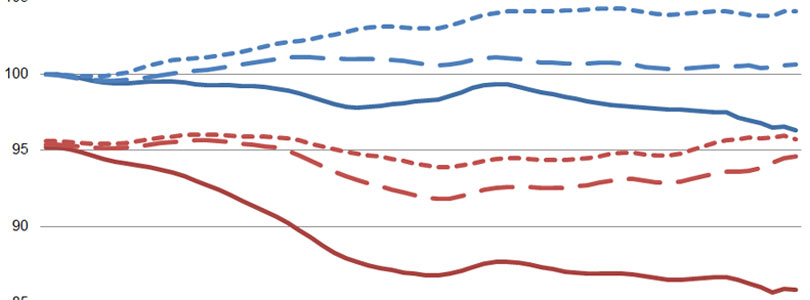
More distressingly, Rhode Island isn’t following the trends of the two states that surround it. The following chart shows the total labor force and employment for Rhode Island, Connecticut, and Massachusetts as a percentage of each state’s total labor force in January 2007. That month, there were 576,593 Rhode Islanders in the labor force, and 95.2% of them were working. If the same number of Rhode Islanders were in the labor force this June, only 85.9% of them would be working.
Connecticut and Massachusetts are shown as broken lines in the chart, and their employment has very nearly returned to its January 2007 level. The reason both states have higher unemployment rates than they did, back then, is that so many more people are looking for work.

Labor force trends respond to the level of available employment, so this is only for academic perspective, but if Rhode Island’s labor force had followed Connecticut’s but maintained its own employment trend, the Ocean State’s unemployment rate would be 17.6%.
In the popular way of assessing Rhode Island’s economy — mostly by tracing the unemployment rate — the state suffered from the nationwide recession from 2007 to 2009 and has been stagnant ever since. That description actually better describes our neighbors.
In little Rhody, a brief and shallow jobs recovery in 2010 has been followed by two years of renewed decline, making even starker the General Assembly and Governor Chafee’s failure to do anything at all to turn the state around.