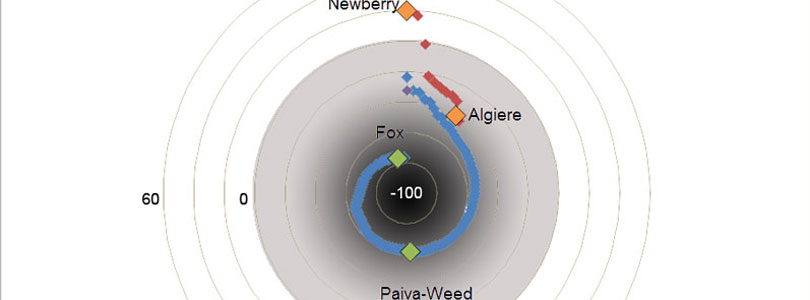
Why RI Languishes, in One Animation
The RI Center for Freedom & Prosperity has released its legislative scorecard and Freedom Index for the 2013 session of the General Assembly. In summary, everything got worse.
Not a single legislator improved his or her score. Some of them — including hard-line progressives — improved their rankings, but that was entirely because their peers did so much worse. The story of last year’s legislative session can best be consolidated in a single animated graphic.
This shows the Freedom Index scores of all legislators for the 2012 session and then the 2013 session. The 2012 session is the one in which there’s actually some space between legislators; the 2013 session (two seconds later) is the one that shows them moving toward consolidation down the drain.
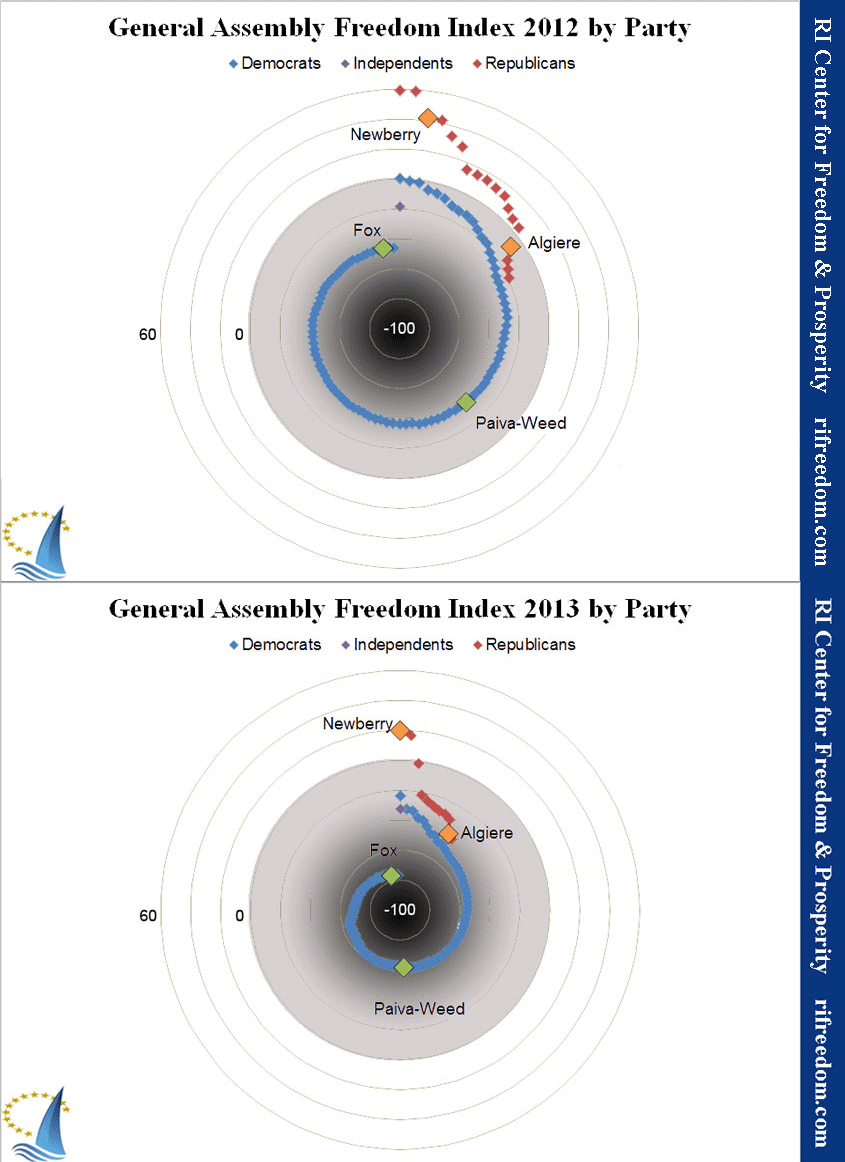
By way of a quick explanation, the Center considers all bills that receive a vote in either chamber, consolidating (as best we can) companion bills to only count once. With input from outside allies, we score the legislation on a scale from -3 to 3 in terms of freedom (mainly economic) and good government.
We then collect all of the legislators’ votes on those bills. A “yea” gets a +1, and a “nay” gets a -1. That way, voting against a bad bill still produces a positive score. The index is based on a percentage of the ideal legislator (from our point of view), so the total possible range is -100 to +100.
I’d note, too, that we found more bills worth scoring in 2013 than in 2012, and there were a lot more bills that almost made the cut.
To some extent, it can be said that former House Speaker Gordon Fox (D, Providence) and Senate President Teresa Paiva-Weed (D, Newport) brought more bad bills (and fewer good ones) to the floors of their respective chambers in 2013. After all, they almost never allow votes on bills that they aren’t positive are going to pass.
But that isn’t an excuse for legislators, because (obviously) they either could have voted against the bills or prevented the bills from reaching the floor by expressing an unwillingness to vote for them.
Anybody wondering why general employment stagnation in the Ocean State turned into a downturn in the late spring and early summer, last year, should consider the above graphic as one of the factors.