The State GDP Growth Race and Some Taxing Milestones
Among yesterday’s news items was the projection that Rhode Island’s job count won’t return to pre-recession levels until at least 2018, under its current economic policy, and that its economy grew less than 1%, inflation adjusted, in 2011. That’s a discouraging round of information to take in, to say the least, but Rhode Islanders don’t necessarily have to take it as an inevitable process of nature.
As The Current pointed out yesterday, a dramatic change in the state’s taxation policy could shock its economy back to more-rapid growth. Meanwhile, it’s still a quip floating through the twitterverse that “tax cuts for the rich” (a catch-all for an aborted capital-gains phase-out during the last decade, a graduated decrease in the flat tax, and an ostensibly revenue-neutral income tax reform in 2010) were supposed to create jobs, yet have not rescued Rhode Island from the tail end of the United States’ economic recovery.
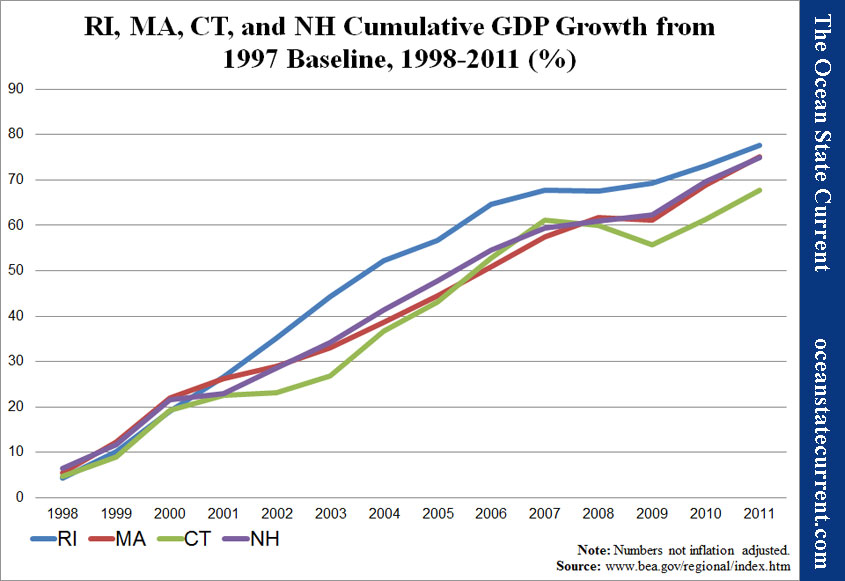
For some context to Rhode Island’s pitiful GDP growth, I plugged the cumulative rates for the our state, Massachusetts, Connecticut, and New Hampshire into a spreadsheet. The following lines reflect the percentage growth from the four states’ level in 1997.
It’s surprising to find that, despite a decade of budgetary pain in state government, with a seemingly annual ordeal of filling deficits with one-time fixes, Rhode Island spent most of the century’s first decade catching up with its much-healthier sister states. In fact, viewed by this metric, little Rhody has still gained more ground since the starting year than the other four states. (I started with 1997 because the U.S. Bureau of Economic Analysis changed its measurements that year.)
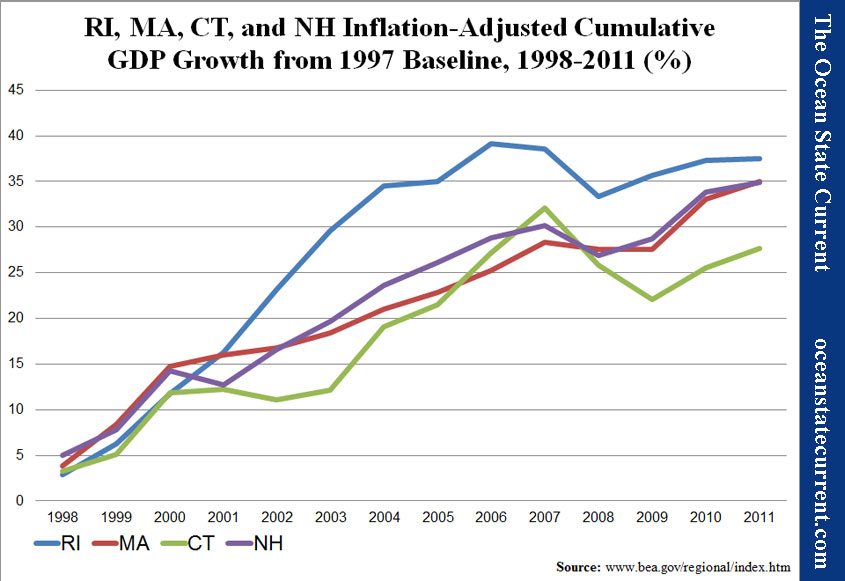
Some (maybe most) of the explanation could be the nature of the two recent economic booms. Rhode Island didn’t profit as much from the dot-com boom at the turn of the century, so it didn’t suffer so much when the bubble burst, and its coastal geography and small size made it particularly susceptible to the boom and bust founded in real estate activity. To gain a more detailed understanding of the trends, I subtracted out the cumulative national inflation rate, which produced the following chart.
It’s notable that Rhode Island began losing ground earlier than the other New England states, in 2006, but after the big downward lurch, our beginnings of recovery in 2009 were actually not too bad, comparatively. It was after that point that the other three states show a marked advance on Rhode Island.
With that chart in mind, the following timeline is interesting (keeping in mind that the public debate surrounding changes is apt to have an effect on economic activity, as well):
- 2002: capital gains tax phase-out enacted (with 2007 as the first year for savings upon the sale of or returns on assets)
- 2006: flat tax reduction begins
- 2007: capital gains tax phase-out frozen (i.e., 2008 rate remained the same as 2007)
- 2009: capital gains tax increased to personal income level (effective 2010)
- 2010: flat tax reduction effectively frozen with income tax reform (effective 2011)
This broad observation and vague correlation of policy and trends doesn’t prove causation, and it certainly doesn’t tease the effects of tax policy from other factors that might put Rhode Island’s economy on a different track from its neighboring states. However, those who attack the approaches to government and taxation reform pursued during Governor Don Carcieri’s terms in office should offer specific explanation of why the state’s economy seemed to do so much better when the public debate was about reducing the costs of government and lightening the burden on the private sector.
ADDENDUM (06/07/12)
Thank you to Director of Revenue Analysis Paul Dion for clarification of the tax timeline; I’ve made changes accordingly (mainly having to do with distinctions between enactment and effective dates).


