Games with Models, 7/28/20 Data, Doom and Denial
It’s been about two weeks since the last “Games with Models” post. Partly, I’ve been busy, and partly, I’ve put them aside because it seemed the COVID-19 numbers were doing things in Rhode Island that made my simplistic model inapplicable. They still are, but the reasons are instructive, including the lesson they provide for the more-sophisticated models of the experts.
So, here’s my latest chart for hospitalizations. By way of a reminder, the red line is the latest data, and then the past few days gradually fade out. For today and yesterday, I extended the calculations out to the end of August, but as you can see, they predict that the entire state would be in the hospital before then.
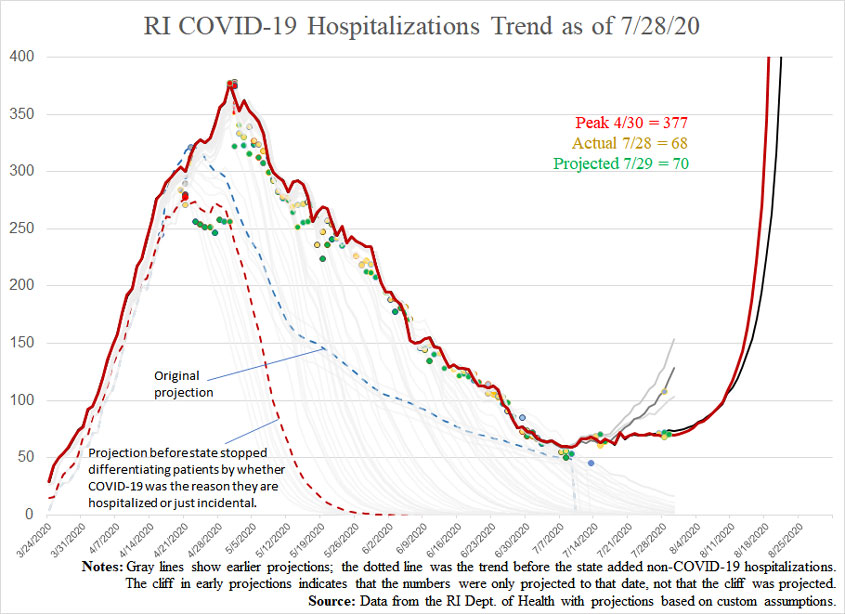
Obviously, that isn’t a very likely outcome. So, why is the model doing this? Some of it is the shift from slowing increases in cases and decreases in hospitalizations to accelerating increases in cases and a modest increase in hospitalizations. But most of the reason a simple calculation predicts truly exponential growth is the rapid change in the ratio between those two metrics.
Around the time my model switched from predicting a continuing decrease to predicting a massive increase, around 10% of “active” cases (assuming people recover after an average of two weeks) were in the hospital. Today’s numbers put that at less than 6%. At both times, there were the same number of people with COVID-19 in the hospital: 68.
Now the obvious response is the refrain we’ve been hearing for weeks about other states, like Texas and Florida: Just wait; hospitalizations are a lagging indicator. I’m not so sure that’s a sufficient corrective.
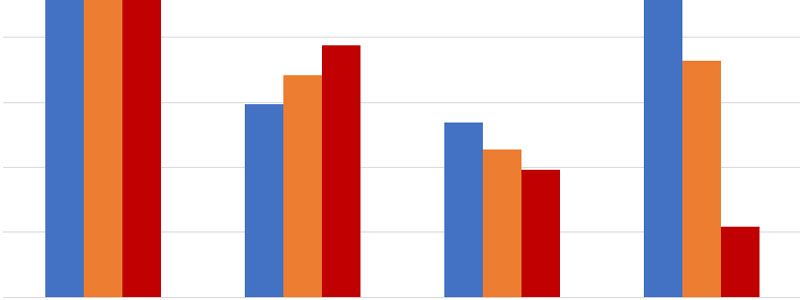
The following chart shows to compound annual growth rates over about two weeks for cumulative cases, hospitalizations and deaths. During the first half of June (while things were getting better), these numbers were increasing by a half percent each day, and increasing faster for deaths and hospitalizations than cases. During the second half of June, all three measures had decreased by about the same percentage.
During the first half of July, however, they continued to drop across the board, although cases were more sluggish. Then in the second half of July, the average daily increase in new cases was back almost to where it was in early June, with hospitalizations increasing at the same time, while deaths continued to decline.
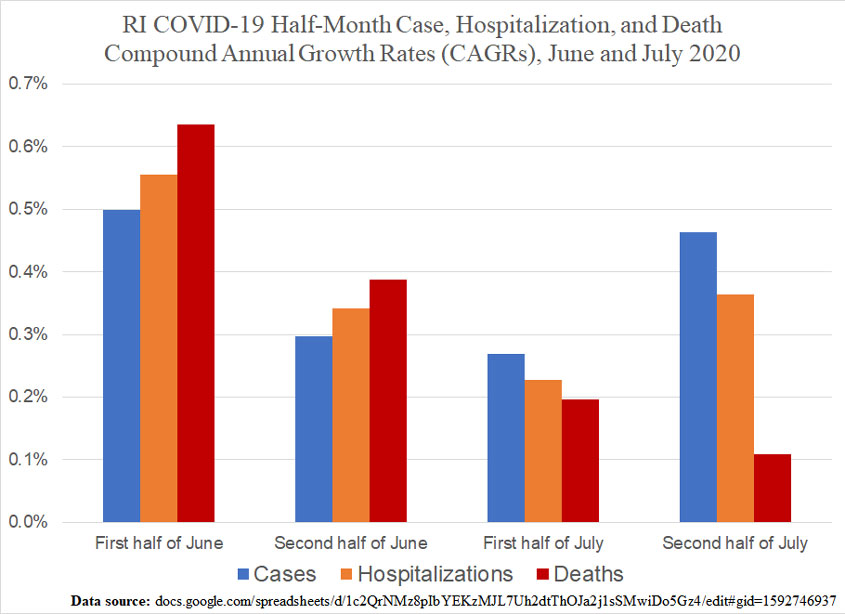
If we were seeing hospitalizations simply lagging cases, and deaths lagging hospitalizations, their CAGRs wouldn’t have decreased in reverse order, and hospitalizations wouldn’t have shot up as much in the last period. They would have lagged.
What we’re probably seeing is testing finding more and more mild cases among younger people at the same time that people are going into the hospital for other reasons but testing positive.
The key point for this post, however, is about how models work. It’s one thing to model a few layers of general trends, but that won’t capture change, and that’s a much different prediction, especially for things that are unprecedented. Not only would a model have to predict changes in the virus and how it interacts with a changing environment, but also the behavior of people. That behavior changes across multiple layers — isolation, social distancing, mask wearing, hand washing, and so on. Throw in the likelihood of treatments as well as people’s likelihood of seeking them. And then, you’d also have to predict changes in who is getting the disease and how it affects them.
So, the lesson from COVID-19 modeling continues to be that, while we should try to use the best tools available to plan for the future, we should be wary of making hugely consequential decisions on the basis of some lines on a chart.
Here is my usual end-of-post information for this series:
(See here for my original methodology and here for a subsequent modification I made. A thorough explanation of the chart is included in this post.)
Projections versus actuals (date of report).
- Cases:
- Projection for 7/28 (from 7/15): 19,085
- Actual for 7/28: 18,725
- Projection for 7/29: ,855
- Hospitalizations:
- Projection for 7/28 (from 7/15): 108
- Actual for 7/28: 68
- Projection for 7/29: 70
- Deaths:
- Projection for 7/28 (from 7/15): 1,065
- Actual for 7/28: 1,005
- Projection for 7/29: 1,012