State in Decline, Employment in RI Cities and Towns: Foster and Glocester
With such small populations for both towns, the employment data for Foster and Glocester ought to be reviewed with due understanding that the results are likely based on extremely small survey samples, which is to say that they rely heavily on the models that the U.S. Bureau of Labor Statistics has developed. That may explain the substantial and abrupt shifts in the line graphs below, as the model was adjusted to reflect new data.
That said, the two towns do present an interesting picture when viewed together. For one thing, both have very high labor market participation rates, relative to the rest of Rhode Island, meaning that a high percentage of residents are either working or looking for work. The ten year trends, from the 2000 U.S. Census to the 2010 iteration, are where the differences appear.
Foster’s population grew 7.8%, while Glocester’s shrank 2.0%. Foster’s number of employed residents actually increased 3.6%, while Glocester’s decreased 5.8%. So how is it that Glocester’s March 2012 unemployment rate was below the state average, at 10.7%, while Foster’s was above it, at 12.5% (all numbers not seasonally adjusted)?
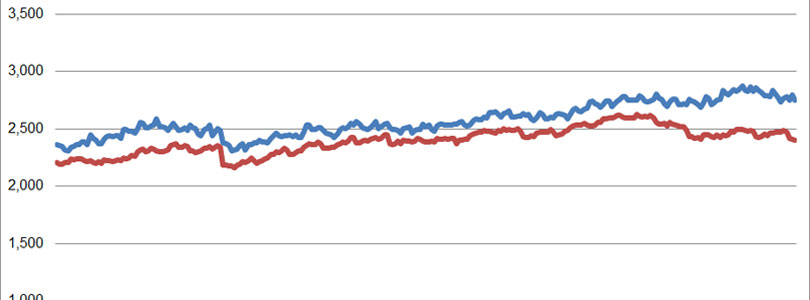
Well, Foster’s total workforce increased 13.7% over the decade, while Glocester’s increased only 1.7%. In other words, more people in Foster decided to work and were unable to find it. The difference can be seen in the red and blue columns in the following two graphs.


Since 2010, the comparison has not changed. Glocester’s labor force is only about 2% above its average over the twenty-two years of RI Dept. of Labor and Training statistics, while its employment is 4% below. In Foster, the labor force is up 7% from the average, while employment is almost exactly at the average.
In the following graphs, unemployment is the distance between the two lines.


Note on the Data
The population data above comes from the U.S. Census conducted every ten years and is therefore generally considered reliable, to the extent that is used as reference for various government programs and voter districting.
The labor force and unemployment data, however, derives from the New England City and Town Areas (NECTAS) segment of the Local Area Unemployment Statistics (LAUS) of the federal Bureau of Labor Statistics (BLS). A detailed summary of the methodology is not readily available, but in basic terms, it is a model based on and benchmarked to several public surveys. It can be assumed that the sample rate (i.e., the number of people actually surveyed) in each Rhode Island town is very small (averaging roughly 30 people per municipality).
The trends shown, it must be emphasized, are most appropriately seen as trends in the model that generally relate to what’s actually happening among the population but are not an immediate reflection of it. Taking action on the assumption that the exact number of employed or unemployed residents shown corresponds directly to real people in a town would vest much too much confidence in the model’s accuracy.
Be that as it may, the data has been collected and published, and taken a town at a time, it is relatively easy to digest. So, curiosity leads the Current to see it as the best available data to deepen our understanding of trends within Rhode Island. If the findings comport with readers’ sense of how the towns relate to each other, perhaps lessons regarding local and statewide policies may be drawn. If not, then the lesson will be on the limitations of data in our era of information overload.
